Download This statistics in other country:
Timeline:
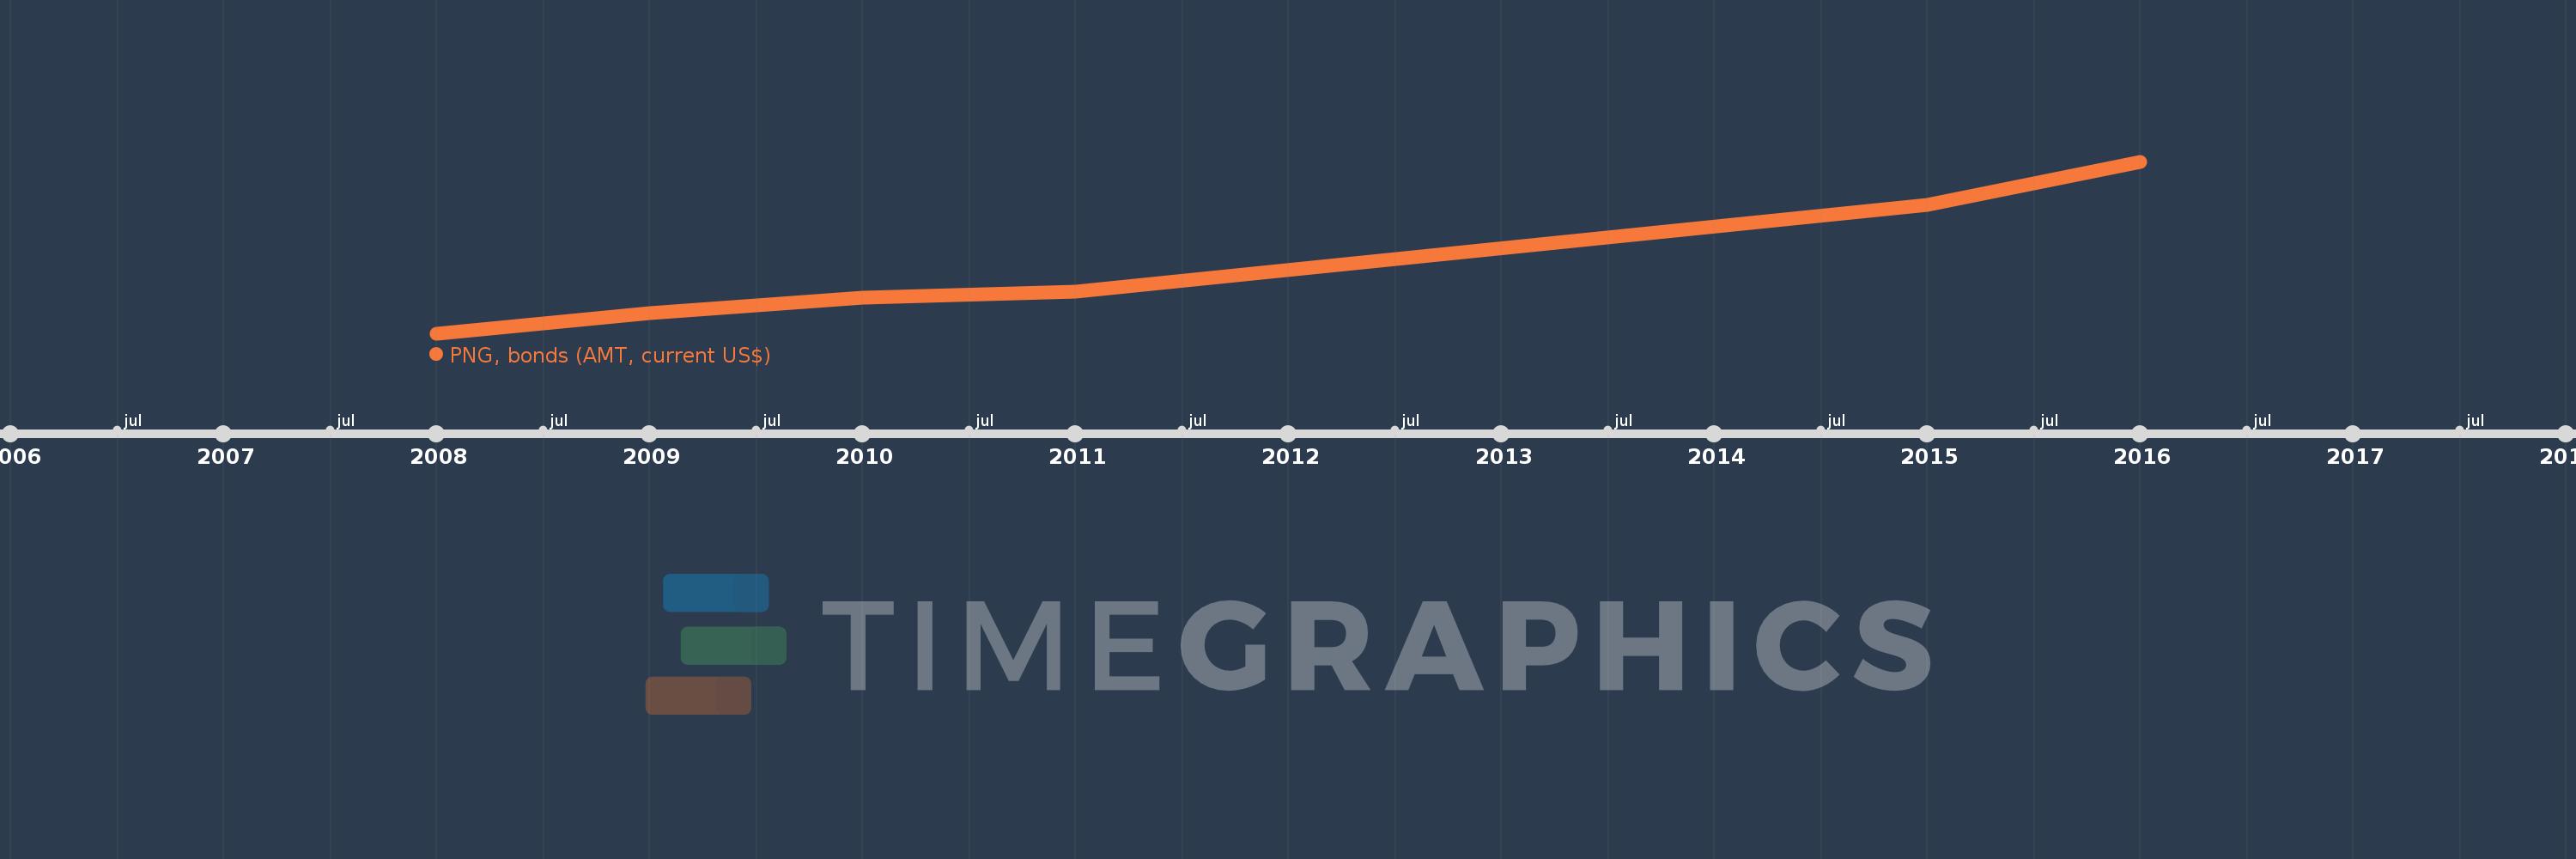
This timeline shows a graph from 2008 to 2016 of Ukraine. No data until 2007. Number of actual observations by date: 6.
Source name:
World Development Indicators
Source organization:
World Bank, International Debt Statistics.
Categories, topics:
External Debt
Last updated:
apr 23, 2017
Indicators value changes by year
Minimum:
129.337 mln
jan 1, 2008
Maximum:
2.885 bln
jan 1, 2016
At the date of observation
Value
Absolute change
Change from the previous value
jan 1, 2008
129.337 mln
+129.337 mln
0.0%
jan 1, 2009
450.0 mln
+320.663 mln
247.93%
jan 1, 2010
695.0 mln
+245.0 mln
54.44%
jan 1, 2011
801.4 mln
+106.4 mln
15.31%
jan 1, 2015
2.189 bln
+1.388 bln
173.2%
jan 1, 2016
2.885 bln
+695.6 mln
31.77%
Ranking of countries by current statistics by years