This timeline shows a graph from 2000 to 2016 of Sub-Saharan Africa (excluding high income). No data until 1999. Number of actual observations by date: 10.
Source name:
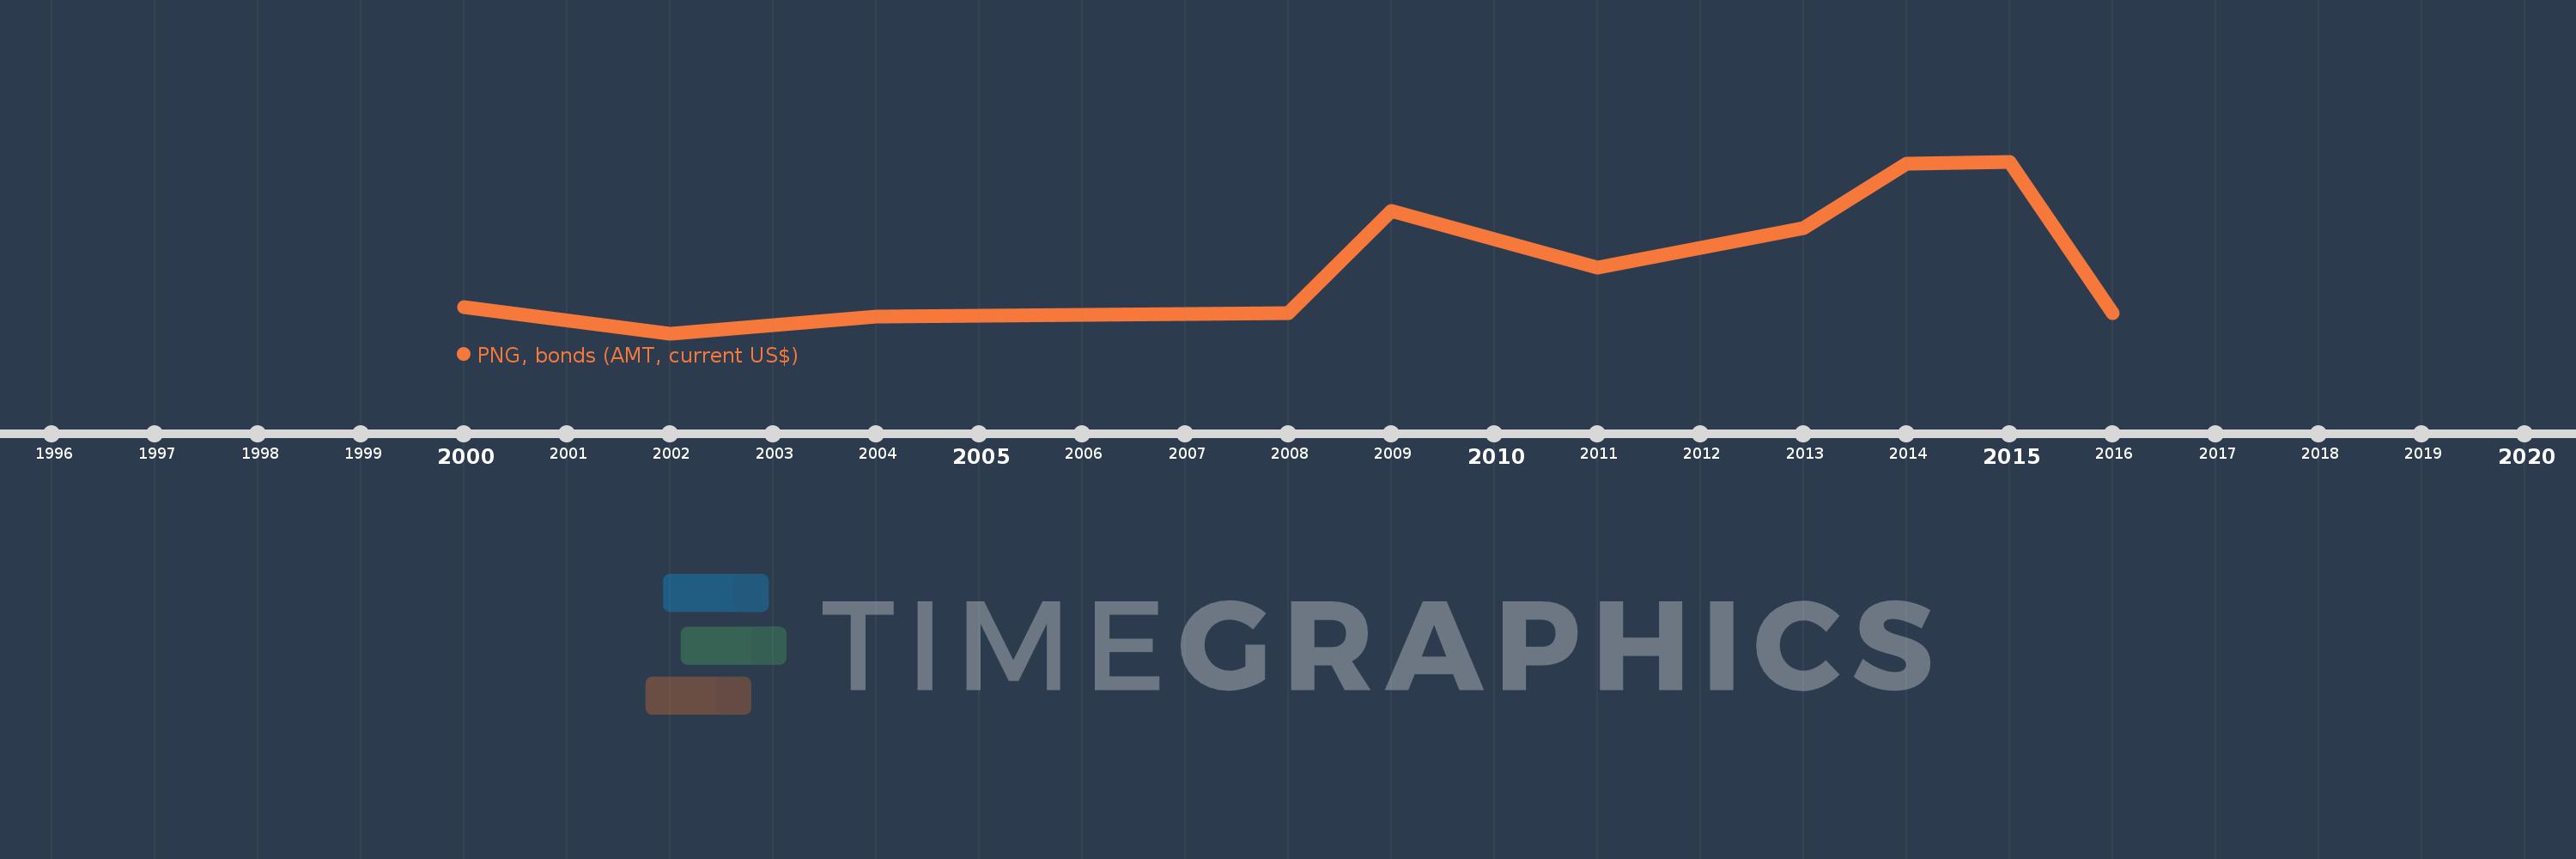
World Development Indicators
Source organization:
World Bank, International Debt Statistics.
Categories, topics:
External Debt
Last updated:
apr 23, 2017
Indicators value changes by year
Meaning:
906.413 mln
Minimum:
45.0 mln
jan 1, 2002
Maximum:
2.104 bln
jan 1, 2015
At the date of observation
Value
Absolute change
Change from the previous value
jan 1, 2000
357.75 mln
+357.75 mln
0.0%
jan 1, 2002
45.0 mln
-312.75 mln
-87.42%
jan 1, 2004
250.0 mln
+205.0 mln
455.56%
jan 1, 2008
287.065 mln
+37.065 mln
14.83%
jan 1, 2009
1.513 bln
+1.226 bln
427.06%
jan 1, 2011
833.676 mln
-679.324 mln
-44.9%
jan 1, 2013
1.307 bln
+473.056 mln
56.74%
jan 1, 2014
2.083 bln
+776.742 mln
59.44%
jan 1, 2015
2.104 bln
+20.8 mln
1.0%
jan 1, 2016
283.157 mln
-1.821 bln
-86.54%
Ranking of countries by current statistics by years