33
/
AIzaSyB4mHJ5NPEv-XzF7P6NDYXjlkCWaeKw5bc
November 30, 2025
269831
Turkey
TUR
true
2
1
PNG, bonds (AMT, current US$)
2016,2015,2014,2013,2012,2011,2010,2008,2006,2005,2004,2002,1998,1994
Create a timeline
Public Timelines
For education
For educational institutions
For teachers
For students
Cabinet
For educational institutions
For teachers
For students
Open cabinet
FAQ
Close
Create a timeline
Public timelines
FAQ
About & Feedback
Terms
Privacy
FAQ
Support 24/7
Cabinet
Get premium
Donate
Download
Global statistics library
→
Turkey
→
PNG, bonds (AMT, current US$)
This statistics in other country:
Argentina
Botswana
Brazil
Bulgaria
China
Colombia
Dominican Republic
East Asia & Pacific (excluding high income)
Ecuador
Egypt, Arab Rep.
Europe & Central Asia (excluding high income)
Ghana
Guatemala
IDA only
India
Indonesia
Jamaica
Kazakhstan
Latin America & Caribbean (excluding high income)
Lebanon
Low & middle income
Lower middle income
Malaysia
Mexico
Middle East & North Africa (excluding high income)
Middle income
Mongolia
Pakistan
Panama
Peru
Philippines
Romania
Russian Federation
Serbia
South Africa
South Asia
Sri Lanka
Sub-Saharan Africa (excluding high income)
Thailand
Turkey
Ukraine
Upper middle income
Venezuela, RB
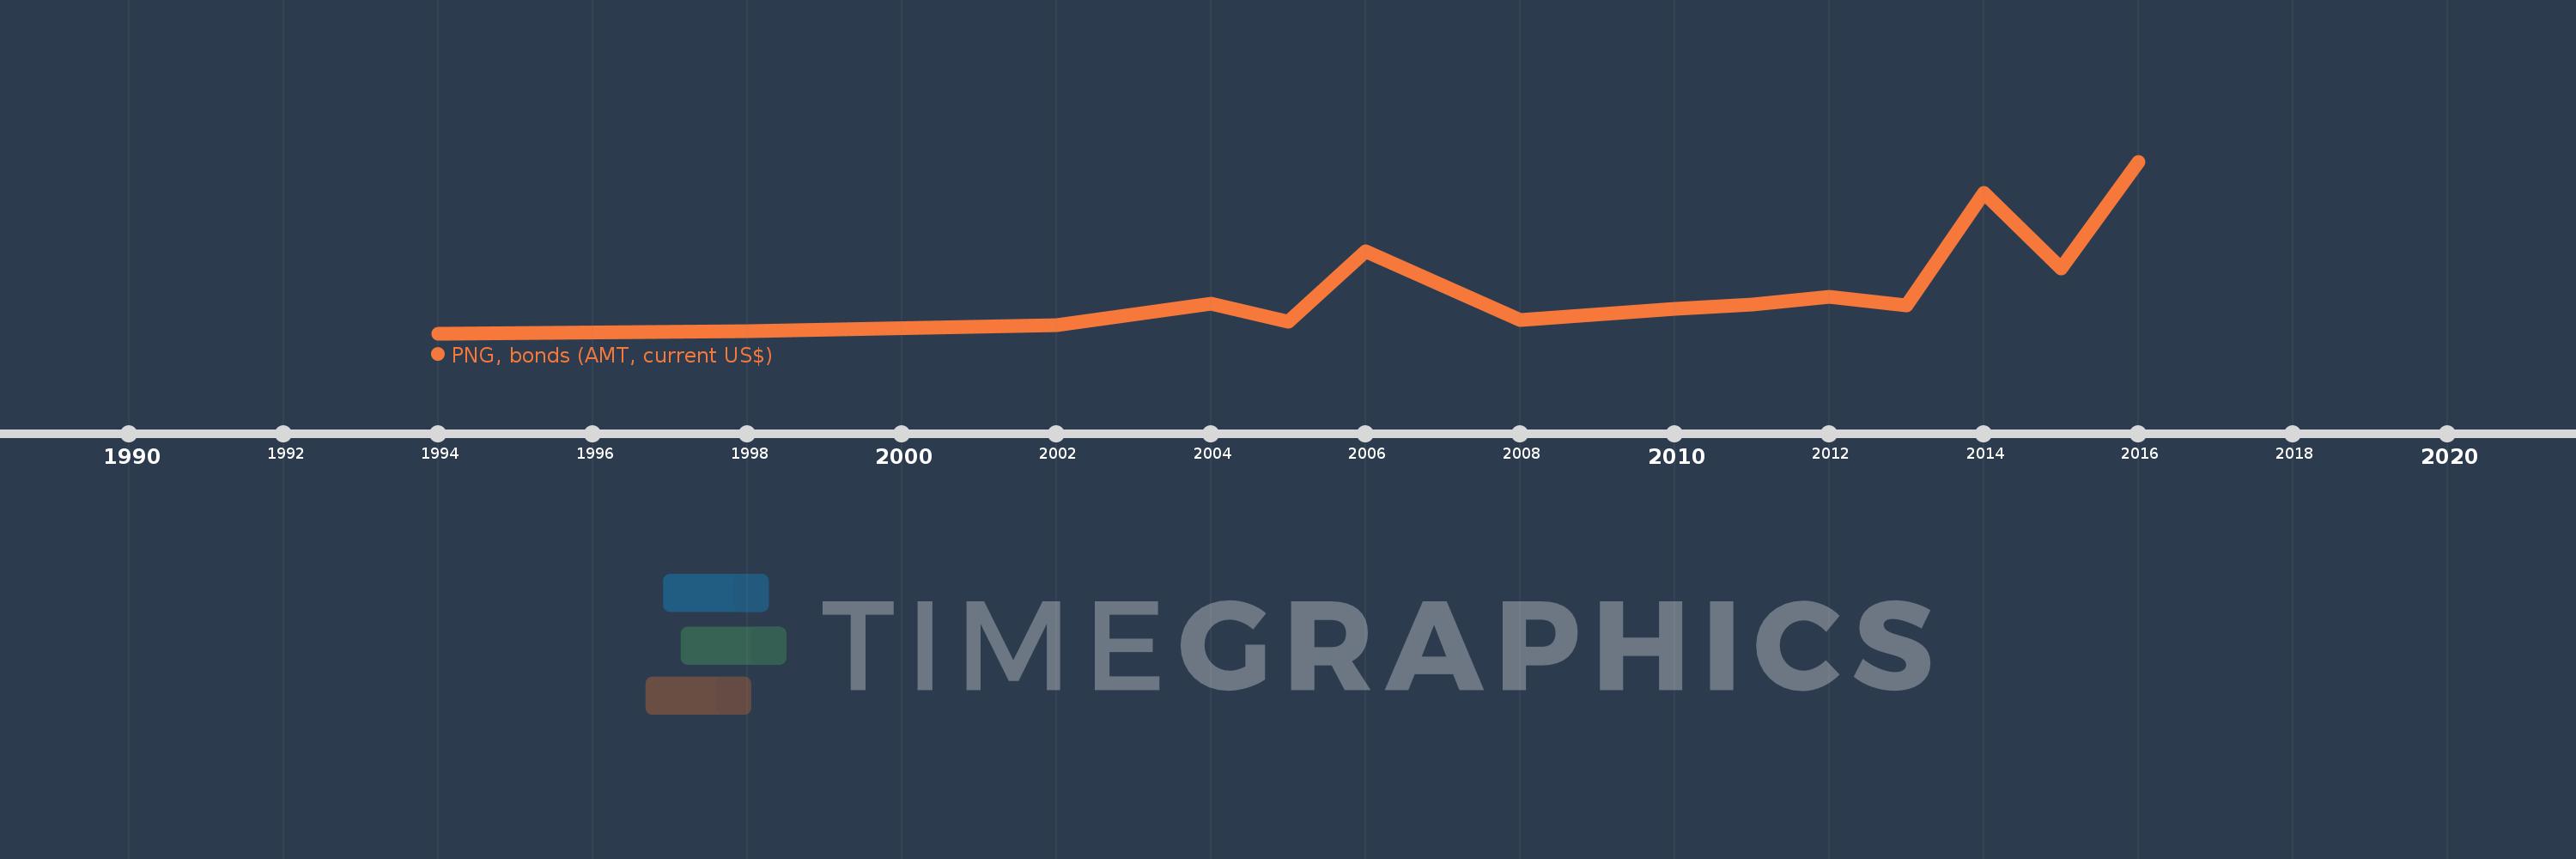
Timeline:
This timeline shows a graph from
1994
to
2016
of Turkey. No data until
1993
. Number of actual observations by date:
14
.
Source name:
World Development Indicators
Source organization:
World Bank, International Debt Statistics.
Categories, topics:
External Debt
Last updated:
apr 23, 2017
Indicators value changes by year
Meaning:
650.989 mln
Minimum:
16.0 mln
jan 1, 1994
Maximum:
2.394 bln
jan 1, 2016
At the date of observation
Value
Absolute change
Change from the previous value
jan 1, 1994
16.0 mln
+16.0 mln
0.0%
jan 1, 1998
50.0 mln
+34.0 mln
212.5%
jan 1, 2002
124.45 mln
+74.45 mln
148.9%
jan 1, 2004
430.978 mln
+306.528 mln
246.31%
jan 1, 2005
172.242 mln
-258.736 mln
-60.03%
jan 1, 2006
1.15 bln
+977.758 mln
567.67%
jan 1, 2008
200.0 mln
-950.0 mln
-82.61%
jan 1, 2010
350.0 mln
+150.0 mln
75.0%
jan 1, 2011
420.0 mln
+70.0 mln
20.0%
jan 1, 2012
522.637 mln
+102.637 mln
24.44%
jan 1, 2013
404.0 mln
-118.637 mln
-22.7%
jan 1, 2014
1.965 bln
+1.561 bln
386.39%
jan 1, 2015
915.0 mln
-1.05 bln
-53.44%
jan 1, 2016
2.394 bln
+1.479 bln
161.59%
Ranking of countries by current statistics by years
About & Feedback
Terms
Privacy
FAQ
Support 24/7
Cabinet
Get premium
Donate
The service accepts bank transfer (ACH, Wire) or cards (Visa, MasterCard, etc). Processed by Stripe.
Secured with SSL