33
/
AIzaSyB4mHJ5NPEv-XzF7P6NDYXjlkCWaeKw5bc
November 30, 2025
156488
Indonesia
IDN
true
2
1
PNG, bonds (AMT, current US$)
2016,2015,2014,2013,2012,2011,2010,2009,2008,2007,2006,2005,2004,2003,2002,2001,2000,1999,1998,1997,1996
Create a timeline
Public Timelines
For education
For educational institutions
For teachers
For students
Cabinet
For educational institutions
For teachers
For students
Open cabinet
FAQ
Close
Create a timeline
Public timelines
FAQ
About & Feedback
Terms
Privacy
FAQ
Support 24/7
Cabinet
Get premium
Donate
Download
Global statistics library
→
Indonesia
→
PNG, bonds (AMT, current US$)
This statistics in other country:
Argentina
Botswana
Brazil
Bulgaria
China
Colombia
Dominican Republic
East Asia & Pacific (excluding high income)
Ecuador
Egypt, Arab Rep.
Europe & Central Asia (excluding high income)
Ghana
Guatemala
IDA only
India
Indonesia
Jamaica
Kazakhstan
Latin America & Caribbean (excluding high income)
Lebanon
Low & middle income
Lower middle income
Malaysia
Mexico
Middle East & North Africa (excluding high income)
Middle income
Mongolia
Pakistan
Panama
Peru
Philippines
Romania
Russian Federation
Serbia
South Africa
South Asia
Sri Lanka
Sub-Saharan Africa (excluding high income)
Thailand
Turkey
Ukraine
Upper middle income
Venezuela, RB
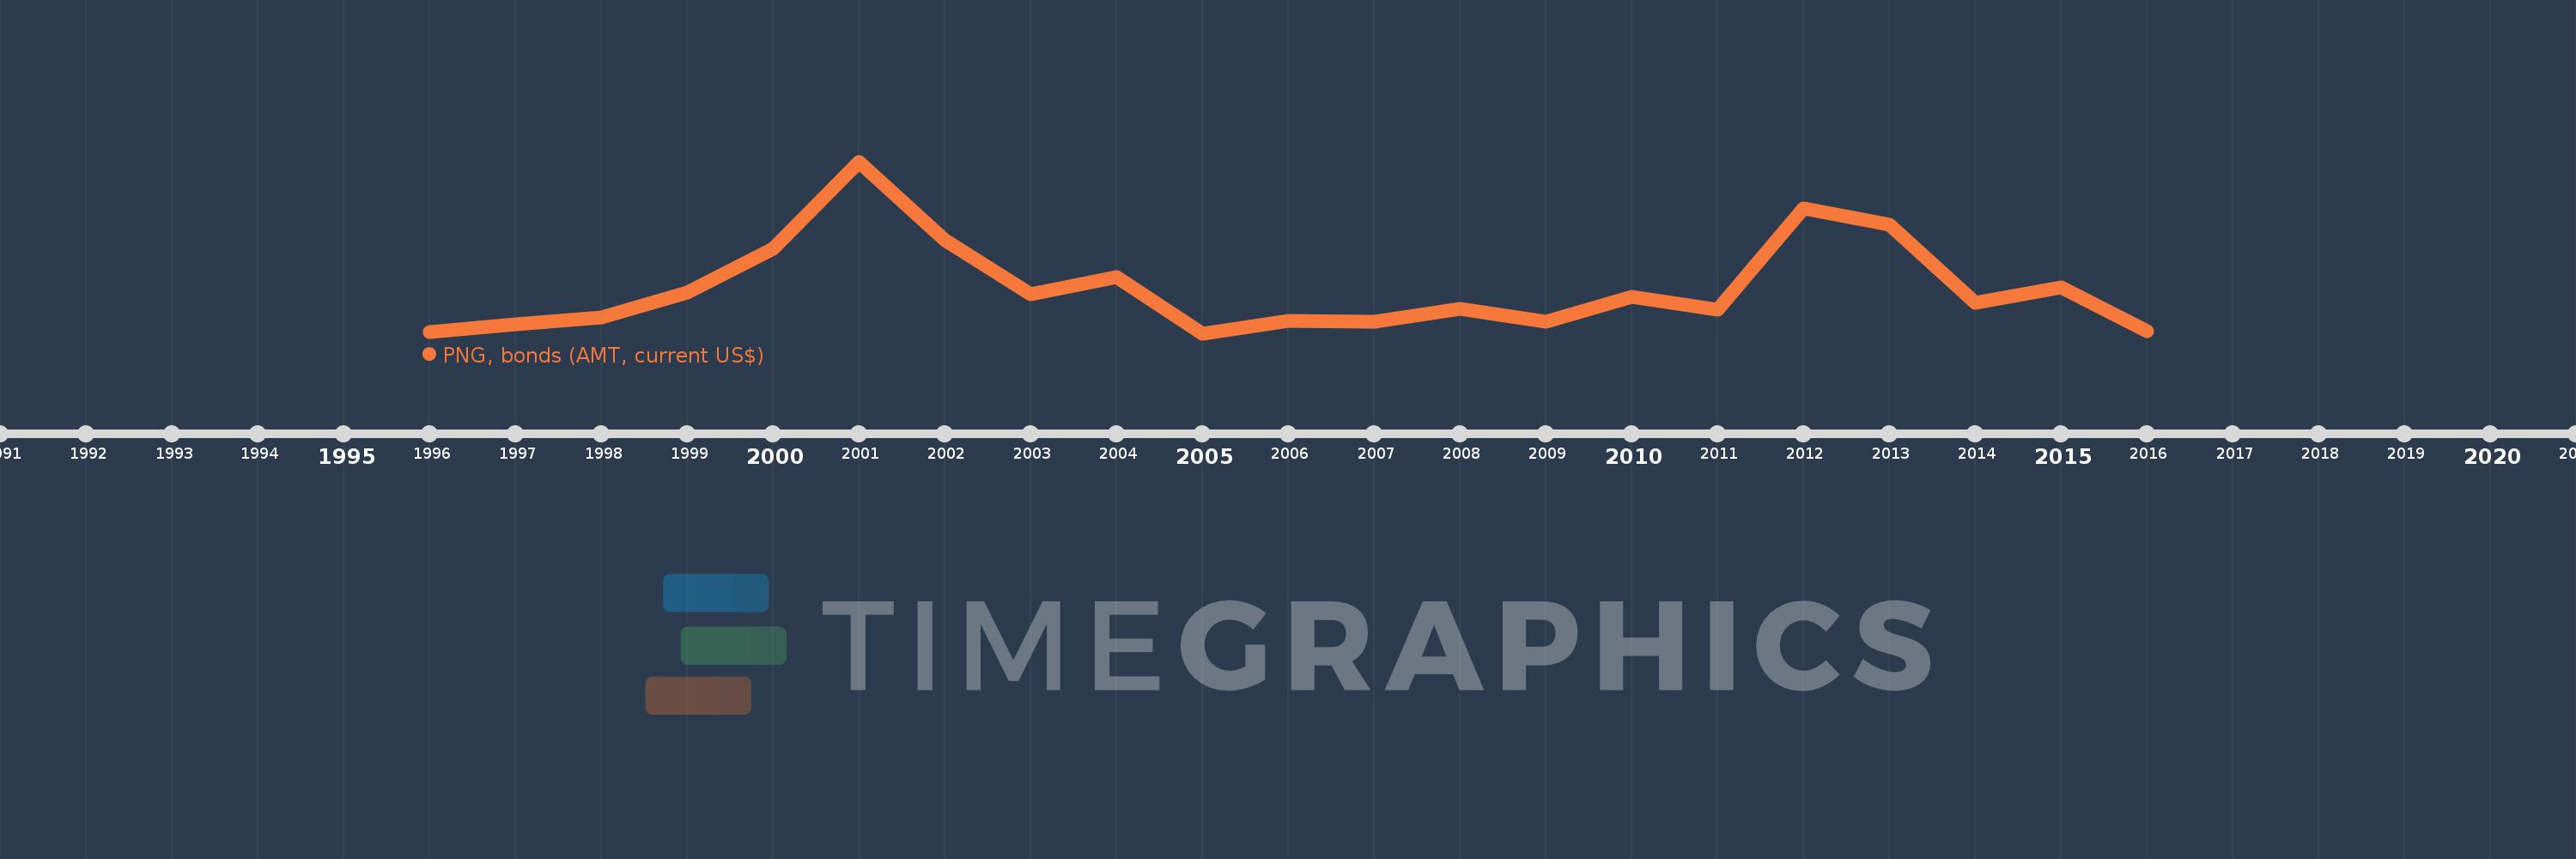
Timeline:
This timeline shows a graph from
1996
to
2016
of Indonesia. No data until
1995
. Number of actual observations by date:
21
.
Source name:
World Development Indicators
Source organization:
World Bank, International Debt Statistics.
Categories, topics:
External Debt
Last updated:
apr 23, 2017
Indicators value changes by year
Meaning:
702.622 mln
Minimum:
100.0 mln
jan 1, 2005
Maximum:
2.4 bln
jan 1, 2001
At the date of observation
Value
Absolute change
Change from the previous value
jan 1, 1996
120.0 mln
+120.0 mln
0.0%
jan 1, 1997
225.059 mln
+105.059 mln
87.55%
jan 1, 1998
308.639 mln
+83.58 mln
37.14%
jan 1, 1999
641.0 mln
+332.361 mln
107.69%
jan 1, 2000
1.238 bln
+596.76 mln
93.1%
jan 1, 2001
2.4 bln
+1.163 bln
93.93%
jan 1, 2002
1.35 bln
-1.05 bln
-43.74%
jan 1, 2003
620.632 mln
-729.768 mln
-54.04%
jan 1, 2004
850.0 mln
+229.368 mln
36.96%
jan 1, 2005
100.0 mln
-750.0 mln
-88.24%
jan 1, 2006
267.362 mln
+167.362 mln
167.36%
jan 1, 2007
256.81 mln
-10.552 mln
-3.95%
jan 1, 2008
431.596 mln
+174.786 mln
68.06%
jan 1, 2009
260.738 mln
-170.858 mln
-39.59%
jan 1, 2010
587.59 mln
+326.852 mln
125.36%
jan 1, 2011
410.978 mln
-176.612 mln
-30.06%
jan 1, 2012
1.771 bln
+1.36 bln
330.92%
jan 1, 2013
1.56 bln
-210.833 mln
-11.9%
jan 1, 2014
510.0 mln
-1.05 bln
-67.31%
jan 1, 2015
715.0 mln
+205.0 mln
40.2%
jan 1, 2016
130.0 mln
-585.0 mln
-81.82%
Ranking of countries by current statistics by years
About & Feedback
Terms
Privacy
FAQ
Support 24/7
Cabinet
Get premium
Donate
The service accepts bank transfer (ACH, Wire) or cards (Visa, MasterCard, etc). Processed by Stripe.
Secured with SSL