33
/
AIzaSyB4mHJ5NPEv-XzF7P6NDYXjlkCWaeKw5bc
November 30, 2025
224070
Philippines
PHL
true
2
1
PNG, bonds (AMT, current US$)
2016,2012,2011,2010,2009,2008,2007,2006,2005,2004,2003,2002,2001,2000,1997
Create a timeline
Public Timelines
For education
For educational institutions
For teachers
For students
Cabinet
For educational institutions
For teachers
For students
Open cabinet
FAQ
Close
Create a timeline
Public timelines
FAQ
About & Feedback
Terms
Privacy
FAQ
Support 24/7
Cabinet
Get premium
Donate
Download
Global statistics library
→
Philippines
→
PNG, bonds (AMT, current US$)
This statistics in other country:
Argentina
Botswana
Brazil
Bulgaria
China
Colombia
Dominican Republic
East Asia & Pacific (excluding high income)
Ecuador
Egypt, Arab Rep.
Europe & Central Asia (excluding high income)
Ghana
Guatemala
IDA only
India
Indonesia
Jamaica
Kazakhstan
Latin America & Caribbean (excluding high income)
Lebanon
Low & middle income
Lower middle income
Malaysia
Mexico
Middle East & North Africa (excluding high income)
Middle income
Mongolia
Pakistan
Panama
Peru
Philippines
Romania
Russian Federation
Serbia
South Africa
South Asia
Sri Lanka
Sub-Saharan Africa (excluding high income)
Thailand
Turkey
Ukraine
Upper middle income
Venezuela, RB
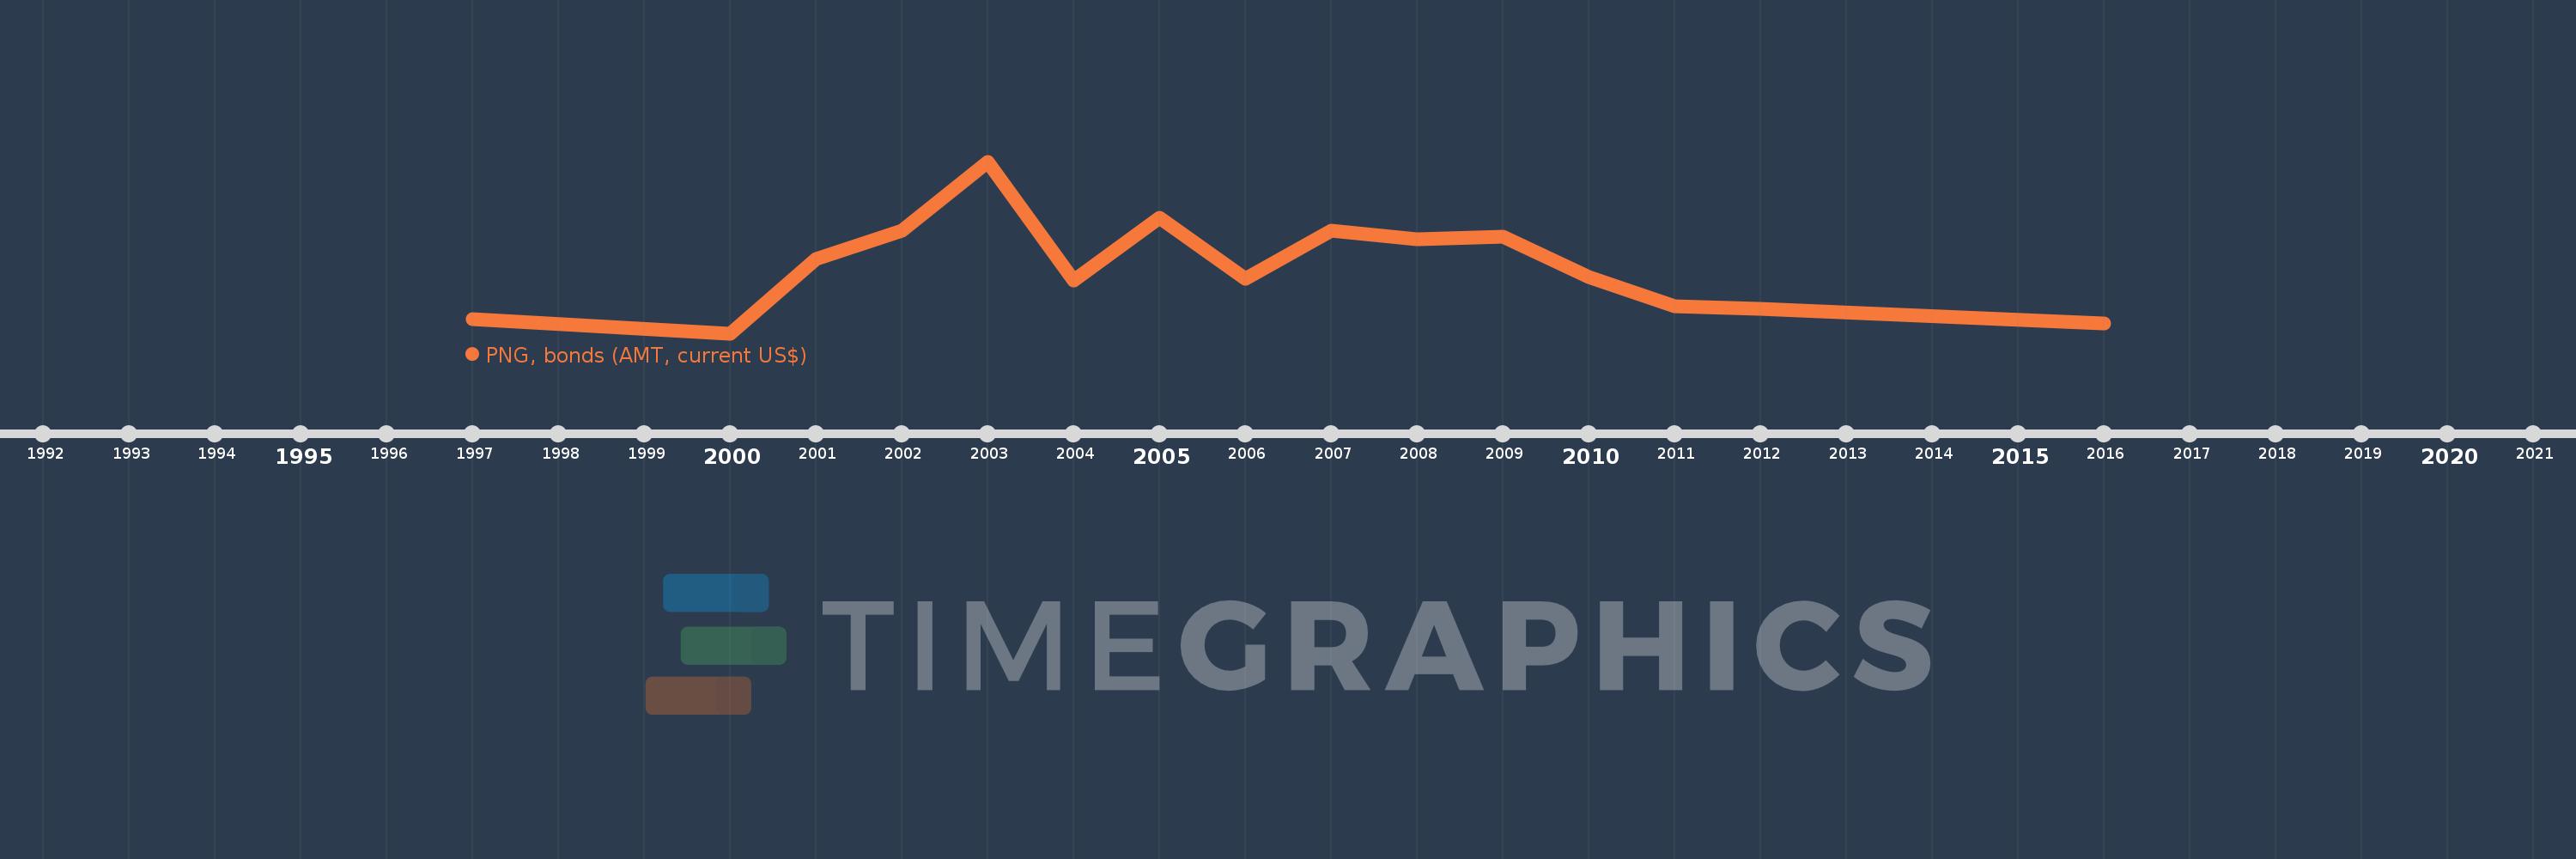
Timeline:
This timeline shows a graph from
1997
to
2016
of Philippines. No data until
1996
. Number of actual observations by date:
15
.
Source name:
World Development Indicators
Source organization:
World Bank, International Debt Statistics.
Categories, topics:
External Debt
Last updated:
apr 23, 2017
Indicators value changes by year
Meaning:
398.626 mln
Minimum:
20.0 mln
jan 1, 2000
Maximum:
998.781 mln
jan 1, 2003
At the date of observation
Value
Absolute change
Change from the previous value
jan 1, 1997
100.0 mln
+100.0 mln
0.0%
jan 1, 2000
20.0 mln
-80.0 mln
-80.0%
jan 1, 2001
444.786 mln
+424.786 mln
2.12K%
jan 1, 2002
604.751 mln
+159.965 mln
35.96%
jan 1, 2003
998.781 mln
+394.03 mln
65.16%
jan 1, 2004
320.499 mln
-678.282 mln
-67.91%
jan 1, 2005
678.695 mln
+358.196 mln
111.76%
jan 1, 2006
333.061 mln
-345.634 mln
-50.93%
jan 1, 2007
603.608 mln
+270.547 mln
81.23%
jan 1, 2008
557.938 mln
-45.67 mln
-7.57%
jan 1, 2009
571.857 mln
+13.919 mln
2.49%
jan 1, 2010
338.856 mln
-233.001 mln
-40.74%
jan 1, 2011
173.824 mln
-165.032 mln
-48.7%
jan 1, 2012
157.741 mln
-16.083 mln
-9.25%
jan 1, 2016
75.0 mln
-82.741 mln
-52.45%
Ranking of countries by current statistics by years
About & Feedback
Terms
Privacy
FAQ
Support 24/7
Cabinet
Get premium
Donate
The service accepts bank transfer (ACH, Wire) or cards (Visa, MasterCard, etc). Processed by Stripe.
Secured with SSL