Download This statistics in other country:
Timeline:
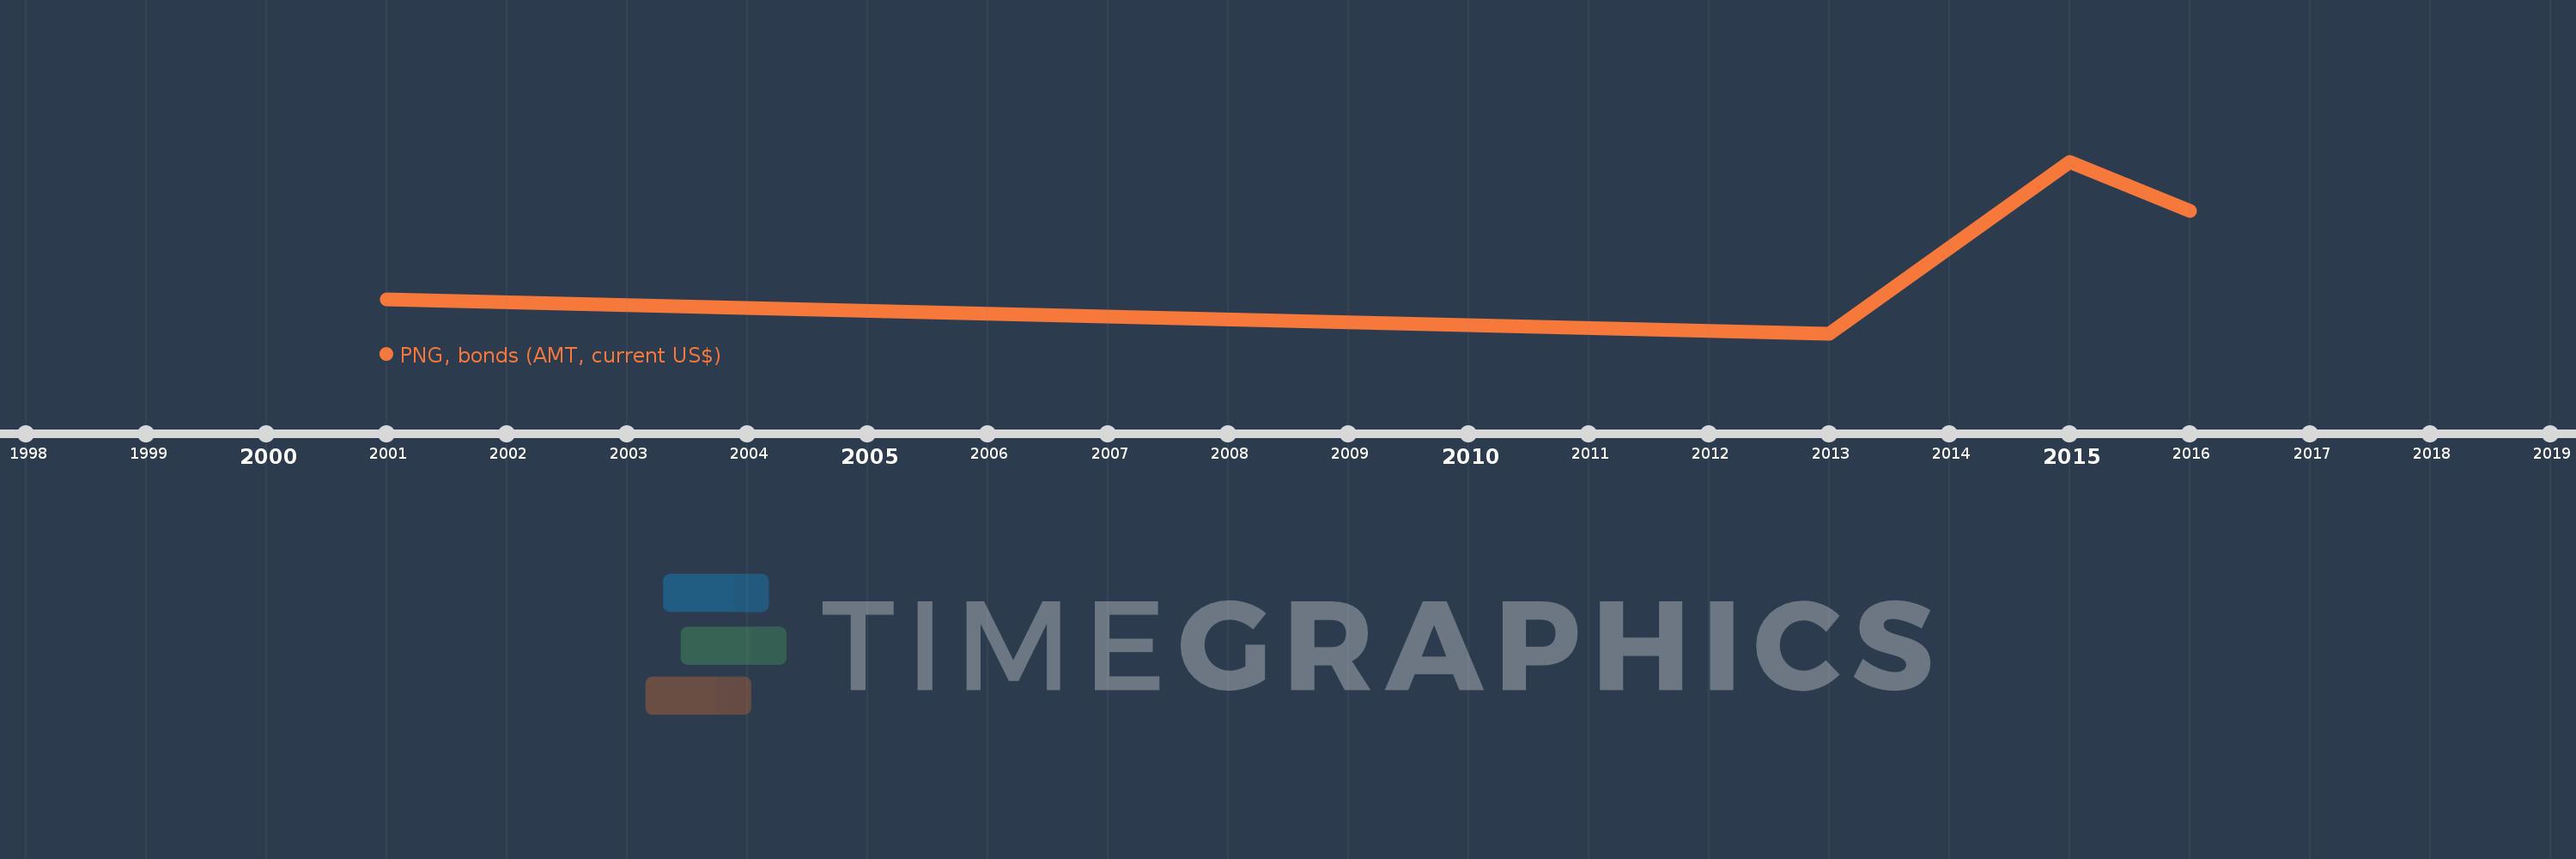
This timeline shows a graph from 2001 to 2016 of Romania. No data until 2000. Number of actual observations by date: 4.
Source name:
World Development Indicators
Source organization:
World Bank, International Debt Statistics.
Categories, topics:
External Debt
Last updated:
apr 23, 2017
Indicators value changes by year
Minimum:
3.983 mln
jan 1, 2013
Maximum:
363.742 mln
jan 1, 2015
At the date of observation
Value
Absolute change
Change from the previous value
jan 1, 2001
75.0 mln
+75.0 mln
0.0%
jan 1, 2013
3.983 mln
-71.017 mln
-94.69%
jan 1, 2015
363.742 mln
+359.759 mln
9.03K%
jan 1, 2016
260.772 mln
-102.97 mln
-28.31%
Ranking of countries by current statistics by years