Download This statistics in other country:
Timeline:
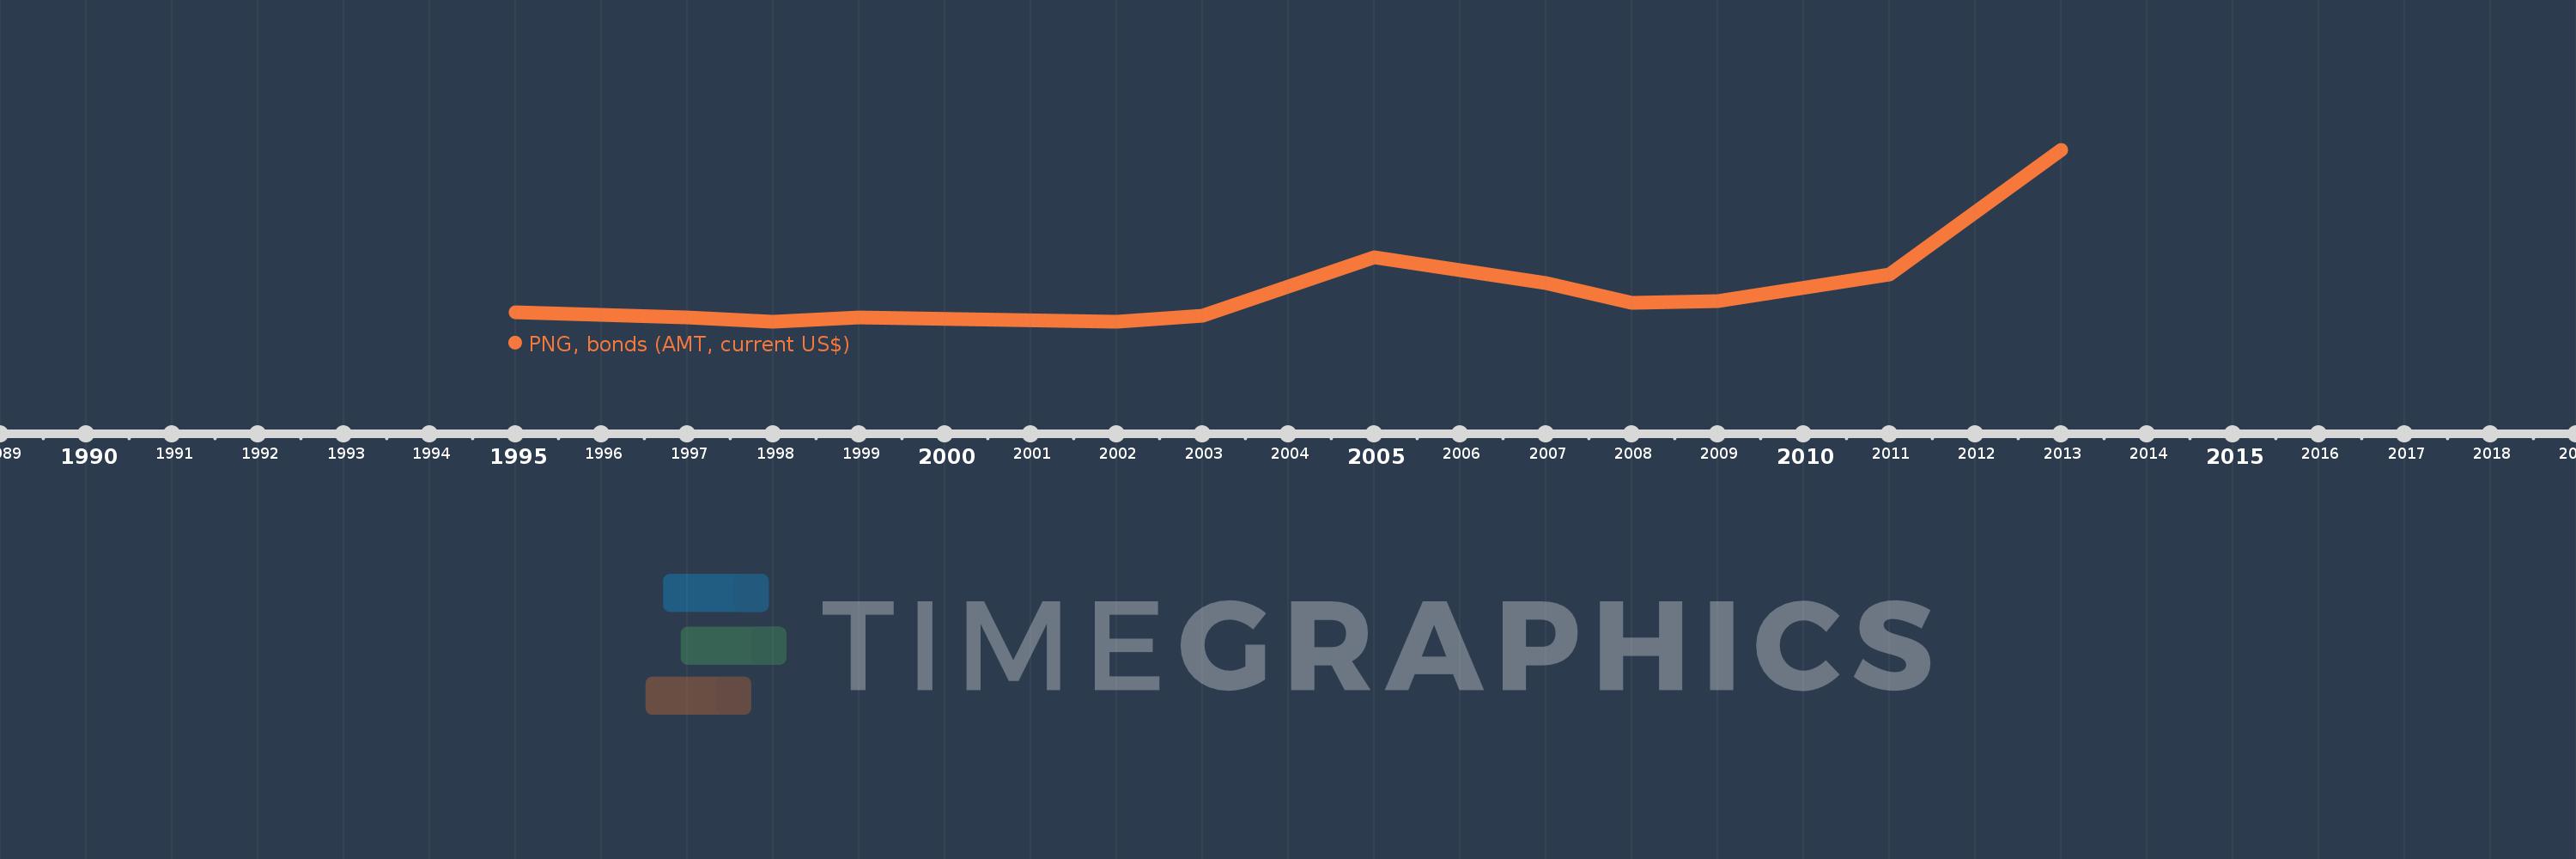
This timeline shows a graph from 1995 to 2013 of Venezuela, RB. No data until 1994. Number of actual observations by date: 12.
Source name:
World Development Indicators
Source organization:
World Bank, International Debt Statistics.
Categories, topics:
External Debt
Last updated:
apr 23, 2017
Indicators value changes by year
Minimum:
15.0 mln
jan 1, 1998
Maximum:
2.365 bln
jan 1, 2013
At the date of observation
Value
Absolute change
Change from the previous value
jan 1, 1995
150.0 mln
+150.0 mln
0.0%
jan 1, 1997
75.0 mln
-75.0 mln
-50.0%
jan 1, 1998
15.0 mln
-60.0 mln
-80.0%
jan 1, 1999
75.0 mln
+60.0 mln
400.0%
jan 1, 2002
20.0 mln
-55.0 mln
-73.33%
jan 1, 2003
100.0 mln
+80.0 mln
400.0%
jan 1, 2005
900.0 mln
+800.0 mln
800.0%
jan 1, 2007
546.052 mln
-353.948 mln
-39.33%
jan 1, 2008
274.0 mln
-272.052 mln
-49.82%
jan 1, 2009
300.0 mln
+26.0 mln
9.49%
jan 1, 2011
659.052 mln
+359.052 mln
119.68%
jan 1, 2013
2.365 bln
+1.706 bln
258.89%
Ranking of countries by current statistics by years