33
/
AIzaSyB4mHJ5NPEv-XzF7P6NDYXjlkCWaeKw5bc
November 30, 2025
230223
Russian Federation
RUS
true
2
1
PNG, bonds (AMT, current US$)
2016,2015,2014,2013,2011,2010,2009,2008,2007,2006,2005,2004,2003,2002,2001
Create a timeline
Public Timelines
For education
For educational institutions
For teachers
For students
Cabinet
For educational institutions
For teachers
For students
Open cabinet
FAQ
Close
Create a timeline
Public timelines
FAQ
About & Feedback
Terms
Privacy
FAQ
Support 24/7
Cabinet
Get premium
Donate
Download
Global statistics library
→
Russian Federation
→
PNG, bonds (AMT, current US$)
This statistics in other country:
Argentina
Botswana
Brazil
Bulgaria
China
Colombia
Dominican Republic
East Asia & Pacific (excluding high income)
Ecuador
Egypt, Arab Rep.
Europe & Central Asia (excluding high income)
Ghana
Guatemala
IDA only
India
Indonesia
Jamaica
Kazakhstan
Latin America & Caribbean (excluding high income)
Lebanon
Low & middle income
Lower middle income
Malaysia
Mexico
Middle East & North Africa (excluding high income)
Middle income
Mongolia
Pakistan
Panama
Peru
Philippines
Romania
Russian Federation
Serbia
South Africa
South Asia
Sri Lanka
Sub-Saharan Africa (excluding high income)
Thailand
Turkey
Ukraine
Upper middle income
Venezuela, RB
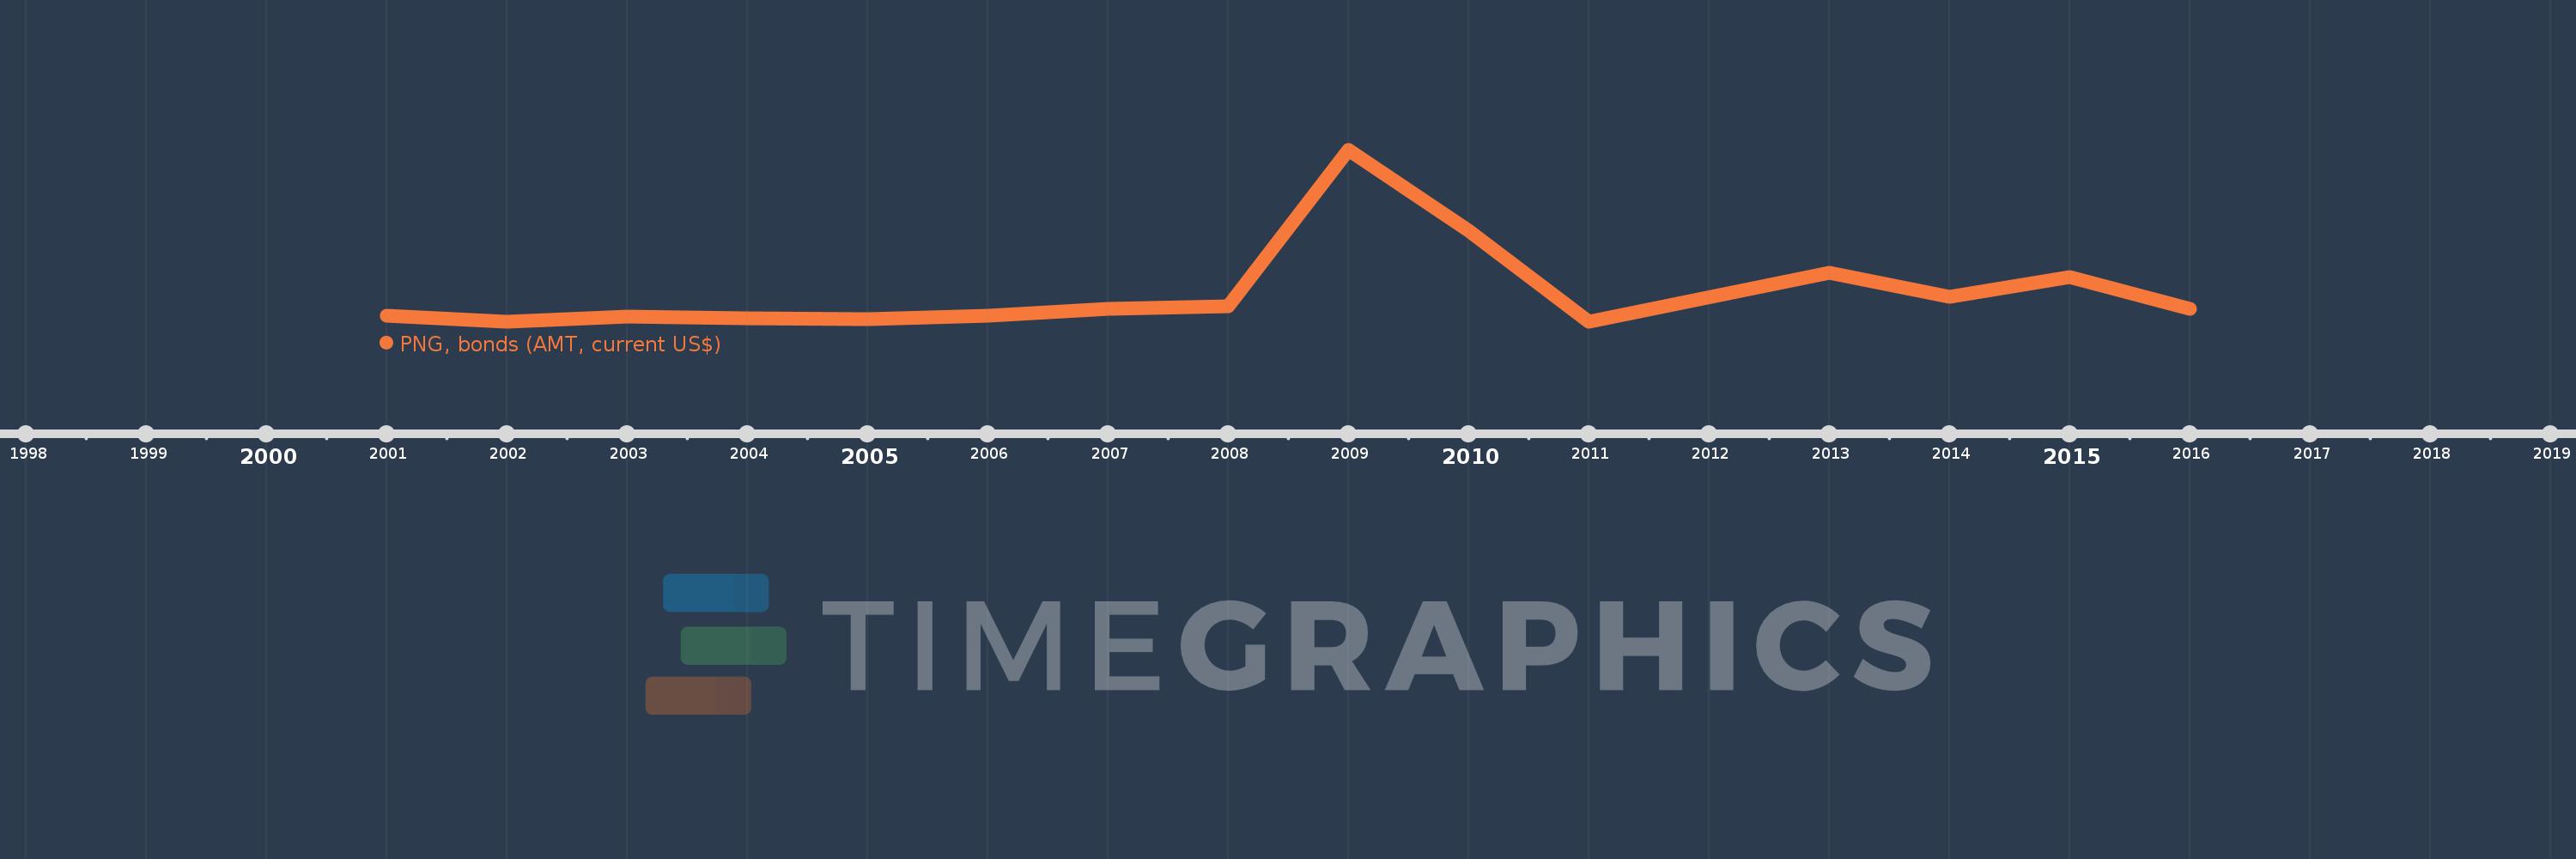
Timeline:
This timeline shows a graph from
2001
to
2016
of Russian Federation. No data until
2000
. Number of actual observations by date:
15
.
Source name:
World Development Indicators
Source organization:
World Bank, International Debt Statistics.
Categories, topics:
External Debt
Last updated:
apr 23, 2017
Indicators value changes by year
Meaning:
3.097 bln
Minimum:
185.859 mln
jan 1, 2011
Maximum:
16.846 bln
jan 1, 2009
At the date of observation
Value
Absolute change
Change from the previous value
jan 1, 2001
825.0 mln
+825.0 mln
0.0%
jan 1, 2002
206.827 mln
-618.173 mln
-74.93%
jan 1, 2003
730.0 mln
+523.173 mln
252.95%
jan 1, 2004
576.166 mln
-153.834 mln
-21.07%
jan 1, 2005
430.0 mln
-146.166 mln
-25.37%
jan 1, 2006
821.863 mln
+391.863 mln
91.13%
jan 1, 2007
1.475 bln
+653.137 mln
79.47%
jan 1, 2008
1.684 bln
+209.313 mln
14.19%
jan 1, 2009
16.846 bln
+15.162 bln
900.17%
jan 1, 2010
9.033 bln
-7.813 bln
-46.38%
jan 1, 2011
185.859 mln
-8.847 bln
-97.94%
jan 1, 2013
4.999 bln
+4.813 bln
2.59K%
jan 1, 2014
2.62 bln
-2.38 bln
-47.6%
jan 1, 2015
4.555 bln
+1.935 bln
73.87%
jan 1, 2016
1.473 bln
-3.082 bln
-67.66%
Ranking of countries by current statistics by years
About & Feedback
Terms
Privacy
FAQ
Support 24/7
Cabinet
Get premium
Donate
The service accepts bank transfer (ACH, Wire) or cards (Visa, MasterCard, etc). Processed by Stripe.
Secured with SSL