29
/
en
AIzaSyAYiBZKx7MnpbEhh9jyipgxe19OcubqV5w
April 1, 2024
96822
Burundi
BDI
true
2
1
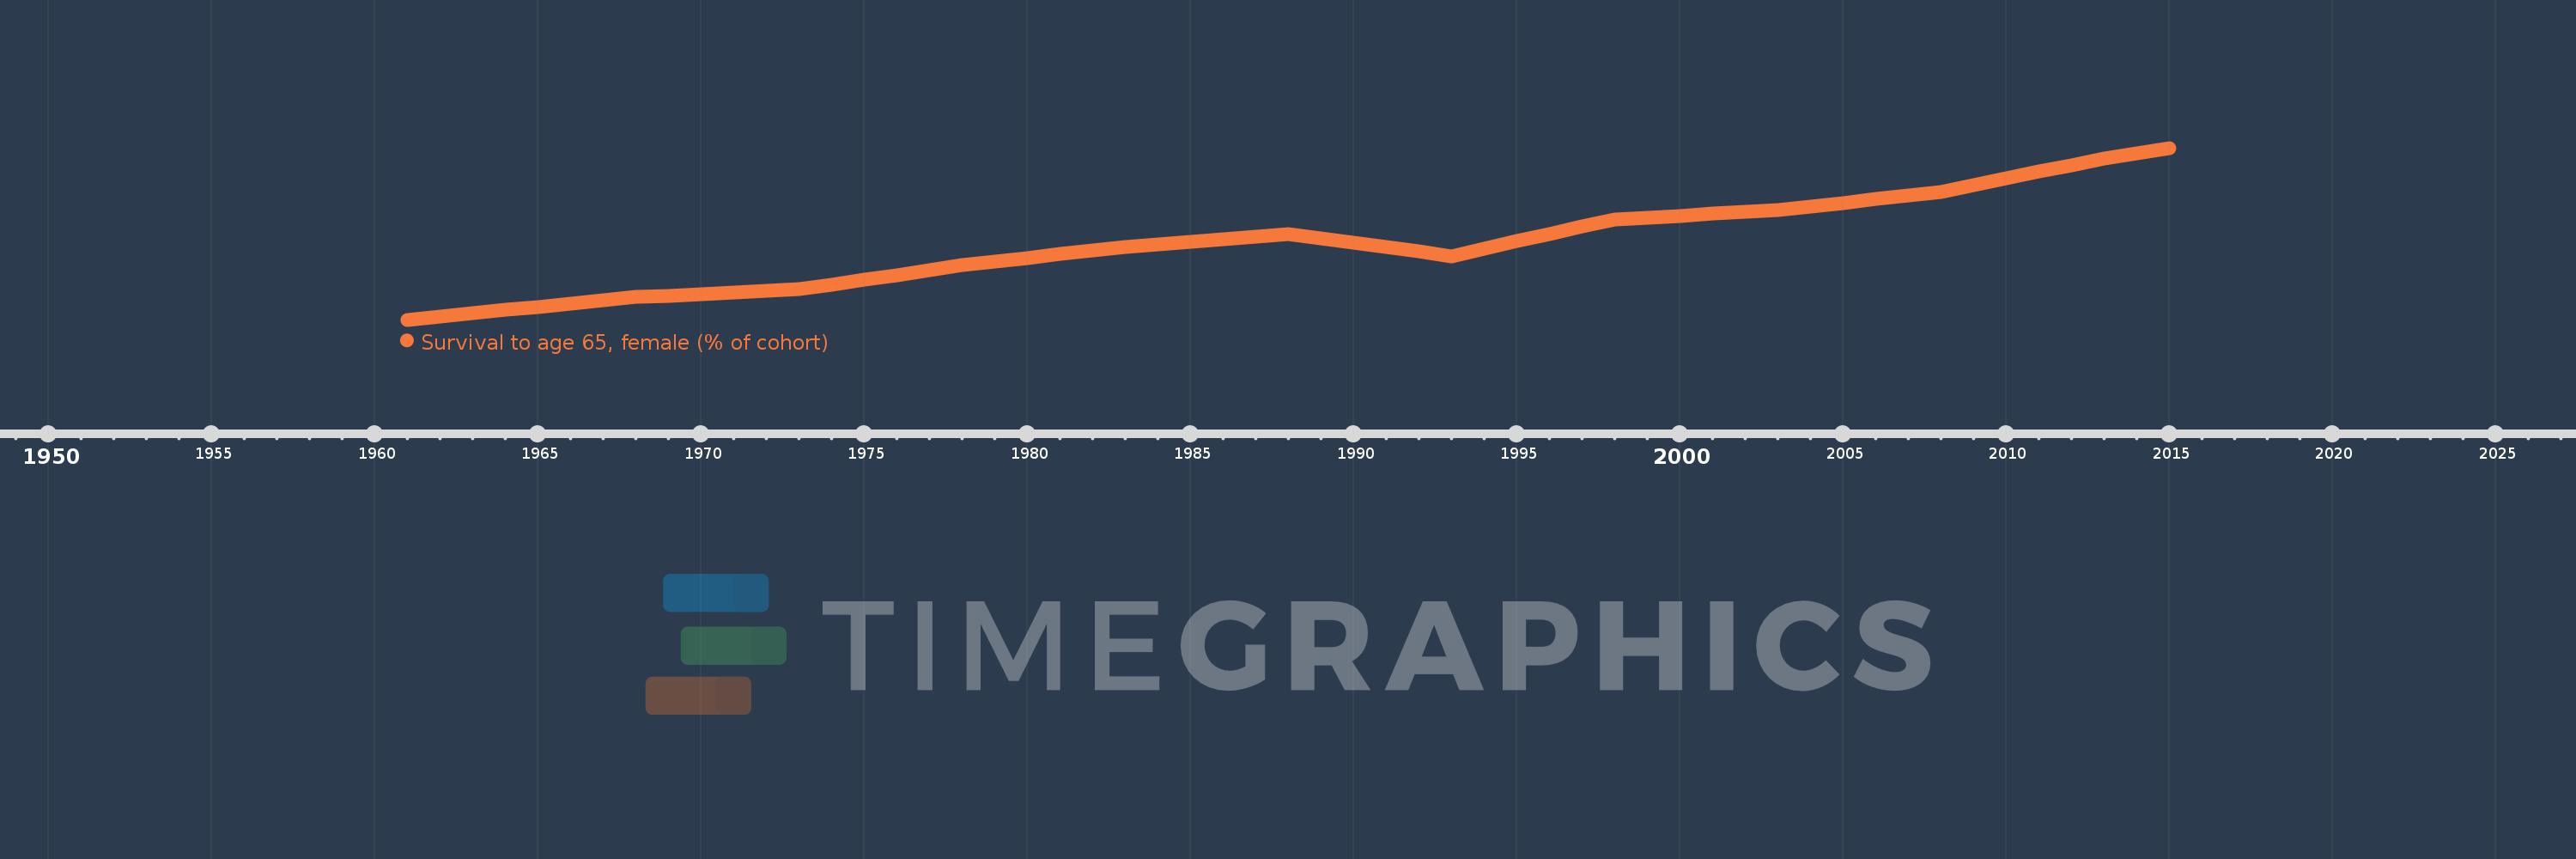
Survival to age 65, female (% of cohort)
2015,2014,2013,2012,2011,2010,2009,2008,2007,2006,2005,2004,2003,2002,2001,2000,1999,1998,1997,1996,1995,1994,1993,1992,1991,1990,1989,1988,1987,1986,1985,1984,1983,1982,1981,1980,1979,1978,1977,1976,1975,1974,1973,1972,1971,1970,1969,1968,1967,1966,1965,1964,1963,1962,1961
This statistics in other country:
AfghanistanAlbaniaAlgeriaAngolaAntigua and BarbudaArab WorldArgentinaArmeniaArubaAustraliaAustriaAzerbaijanBahamas, TheBahrainBangladeshBarbadosBelarusBelgiumBelizeBeninBhutanBoliviaBosnia and HerzegovinaBotswanaBrazilBrunei DarussalamBulgariaBurkina FasoBurundiCabo VerdeCambodiaCameroonCanadaCaribbean small statesCentral African RepublicCentral Europe and the BalticsChadChannel IslandsChileChinaColombiaComorosCongo, Dem. Rep.Congo, Rep.Costa RicaCote d'IvoireCroatiaCubaCuracaoCyprusCzech RepublicDenmarkDjiboutiDominican RepublicEarly-demographic dividendEast Asia & PacificEast Asia & Pacific (excluding high income)East Asia & Pacific (IDA & IBRD countries)EcuadorEgypt, Arab Rep.El SalvadorEquatorial GuineaEritreaEstoniaEthiopiaEuro areaEurope & Central AsiaEurope & Central Asia (excluding high income)Europe & Central Asia (IDA & IBRD countries)European UnionFijiFinlandFragile and conflict affected situationsFranceFrench PolynesiaGabonGambia, TheGeorgiaGermanyGhanaGreeceGrenadaGuamGuatemalaGuineaGuinea-BissauGuyanaHaitiHeavily indebted poor countries (HIPC)High incomeHondurasHong Kong SAR, ChinaHungaryIBRD onlyIcelandIDA & IBRD totalIDA blendIDA onlyIDA totalIndiaIndonesiaIran, Islamic Rep.IraqIrelandIsraelItalyJamaicaJapanJordanKazakhstanKenyaKiribatiKorea, Dem. People’s Rep.Korea, Rep.KuwaitKyrgyz RepublicLao PDRLate-demographic dividendLatin America & Caribbean Latin America & Caribbean (excluding high income)Latin America & the Caribbean (IDA & IBRD countries)LatviaLeast developed countries: UN classificationLebanonLesothoLiberiaLibyaLithuaniaLow & middle incomeLow incomeLower middle incomeLuxembourgMacao SAR, ChinaMacedonia, FYRMadagascarMalawiMalaysiaMaldivesMaliMaltaMauritaniaMauritiusMexicoMicronesia, Fed. Sts.Middle East & North AfricaMiddle East & North Africa (excluding high income)Middle East & North Africa (IDA & IBRD countries)Middle incomeMoldovaMongoliaMontenegroMoroccoMozambiqueMyanmarNamibiaNepalNetherlandsNew CaledoniaNew ZealandNicaraguaNigerNigeriaNorth AmericaNorwayOECD membersOmanOther small statesPacific island small statesPakistanPanamaPapua New GuineaParaguayPeruPhilippinesPolandPortugalPost-demographic dividendPre-demographic dividendPuerto RicoQatarRomaniaRussian FederationRwandaSamoaSao Tome and PrincipeSaudi ArabiaSenegalSerbiaSeychellesSierra LeoneSingaporeSlovak RepublicSloveniaSmall statesSolomon IslandsSomaliaSouth AfricaSouth AsiaSouth Asia (IDA & IBRD)South SudanSpainSri LankaSt. LuciaSt. Vincent and the GrenadinesSub-Saharan Africa Sub-Saharan Africa (excluding high income)Sub-Saharan Africa (IDA & IBRD countries)SudanSurinameSwazilandSwedenSwitzerlandSyrian Arab RepublicTajikistanTanzaniaThailandTimor-LesteTogoTongaTrinidad and TobagoTunisiaTurkeyTurkmenistanUgandaUkraineUnited Arab EmiratesUnited KingdomUnited StatesUpper middle incomeUruguayUzbekistanVanuatuVenezuela, RBVietnamVirgin Islands (U.S.)West Bank and GazaWorldYemen, Rep.ZambiaZimbabwe Timeline:
This timeline shows a graph from 1961 to 2015 of Burundi. No data until 1960. Number of actual observations by date: 55.
Source name:
World Development Indicators
Source organization:
United Nations Population Division. World Population Prospects. New York, United Nations, Department of Economic and Social Affairs (advanced Excel tables). Available at http://esa.un.org/wpp/unpp/panel_population.htm.
Categories, topics:
Health, Gender
Last updated:
apr 23, 2017
Indicators value changes by year
Minimum:
35.087
jan 1, 1961
Maximum:
57.157
jan 1, 2015
At the date of observation
Value
Absolute change
Change from previous value
jan 1, 1961
35.087
+35.087
0.0%
jan 1, 1962
35.5
+0.413
1.18%
jan 1, 1963
35.913
+0.413
1.16%
jan 1, 1964
36.33
+0.416
1.16%
jan 1, 1965
36.746
+0.416
1.15%
jan 1, 1966
37.162
+0.416
1.13%
jan 1, 1967
37.579
+0.416
1.12%
jan 1, 1968
37.995
+0.416
1.11%
jan 1, 1969
38.192
+0.197
0.52%
jan 1, 1970
38.389
+0.197
0.52%
jan 1, 1971
38.586
+0.197
0.51%
jan 1, 1972
38.783
+0.197
0.51%
jan 1, 1973
38.981
+0.197
0.51%
jan 1, 1974
39.597
+0.616
1.58%
jan 1, 1975
40.214
+0.616
1.56%
jan 1, 1976
40.83
+0.616
1.53%
jan 1, 1977
41.446
+0.616
1.51%
jan 1, 1978
42.063
+0.616
1.49%
jan 1, 1979
42.544
+0.481
1.14%
jan 1, 1980
43.025
+0.481
1.13%
jan 1, 1981
43.506
+0.481
1.12%
jan 1, 1982
43.987
+0.481
1.11%
jan 1, 1983
44.468
+0.481
1.09%
jan 1, 1984
44.789
+0.321
0.72%
jan 1, 1985
45.11
+0.321
0.72%
jan 1, 1986
45.431
+0.321
0.71%
jan 1, 1987
45.753
+0.321
0.71%
jan 1, 1988
46.074
+0.321
0.7%
jan 1, 1989
45.513
-0.561
-1.22%
jan 1, 1990
44.952
-0.561
-1.23%
jan 1, 1991
44.391
-0.561
-1.25%
jan 1, 1992
43.83
-0.561
-1.26%
jan 1, 1993
43.269
-0.561
-1.28%
jan 1, 1994
44.211
+0.942
2.18%
jan 1, 1995
45.153
+0.942
2.13%
jan 1, 1996
46.095
+0.942
2.09%
jan 1, 1997
47.037
+0.942
2.04%
jan 1, 1998
47.979
+0.942
2.0%
jan 1, 1999
48.216
+0.237
0.49%
jan 1, 2000
48.453
+0.237
0.49%
jan 1, 2001
48.69
+0.237
0.49%
jan 1, 2002
48.928
+0.237
0.49%
jan 1, 2003
49.165
+0.237
0.48%
jan 1, 2004
49.636
+0.472
0.96%
jan 1, 2005
50.108
+0.472
0.95%
jan 1, 2006
50.579
+0.472
0.94%
jan 1, 2007
51.051
+0.472
0.93%
jan 1, 2008
51.523
+0.472
0.92%
jan 1, 2009
52.381
+0.859
1.67%
jan 1, 2010
53.24
+0.859
1.64%
jan 1, 2011
54.099
+0.859
1.61%
jan 1, 2012
54.958
+0.859
1.59%
jan 1, 2013
55.817
+0.859
1.56%
jan 1, 2014
56.487
+0.67
1.2%
jan 1, 2015
57.157
+0.67
1.19%
Ranking of countries by current statistics by years


Comments: