29
/
en
AIzaSyAYiBZKx7MnpbEhh9jyipgxe19OcubqV5w
April 1, 2024
26159
Central Europe and the Baltics
CEB
false
2
1
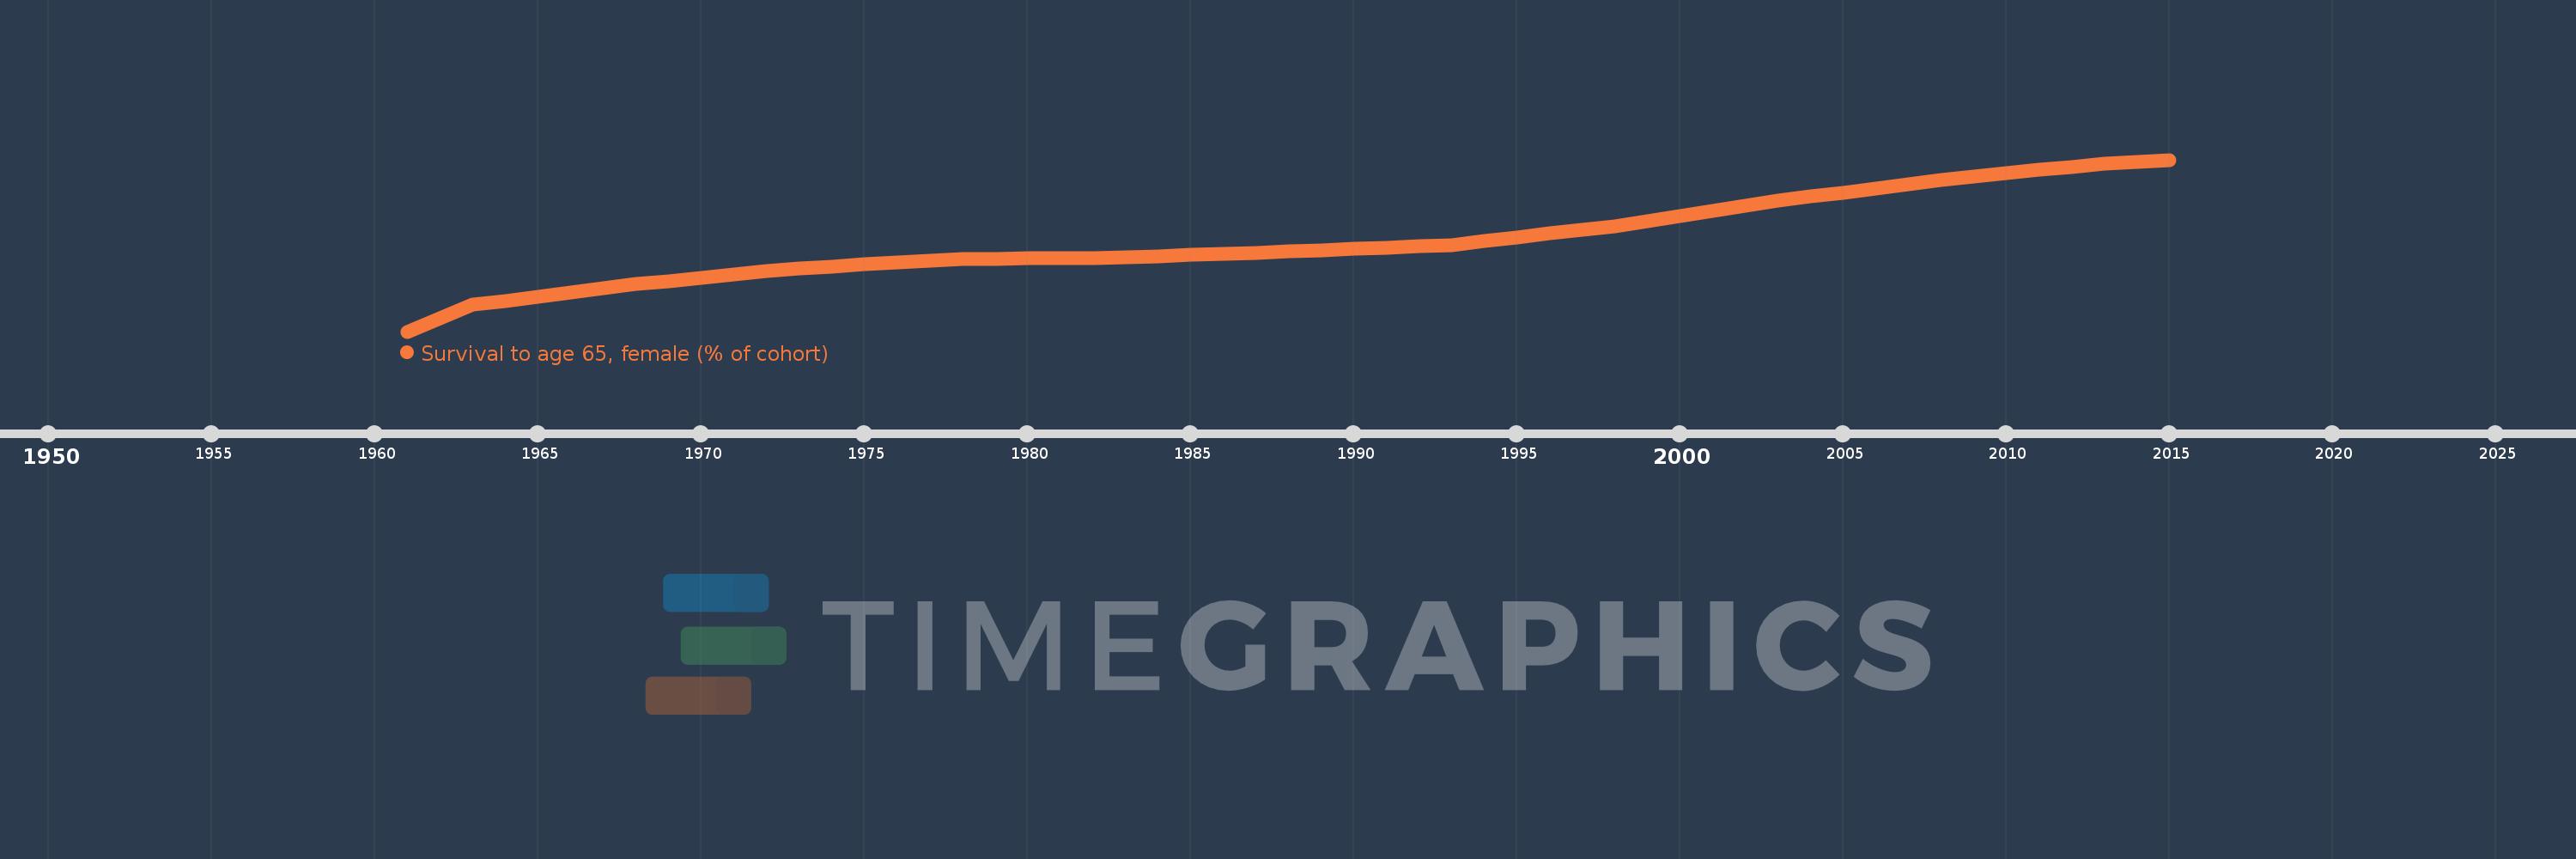
Survival to age 65, female (% of cohort)
2015,2014,2013,2012,2011,2010,2009,2008,2007,2006,2005,2004,2003,2002,2001,2000,1999,1998,1997,1996,1995,1994,1993,1992,1991,1990,1989,1988,1987,1986,1985,1984,1983,1982,1981,1980,1979,1978,1977,1976,1975,1974,1973,1972,1971,1970,1969,1968,1967,1966,1965,1964,1963,1962,1961
This statistics in other country:
AfghanistanAlbaniaAlgeriaAngolaAntigua and BarbudaArab WorldArgentinaArmeniaArubaAustraliaAustriaAzerbaijanBahamas, TheBahrainBangladeshBarbadosBelarusBelgiumBelizeBeninBhutanBoliviaBosnia and HerzegovinaBotswanaBrazilBrunei DarussalamBulgariaBurkina FasoBurundiCabo VerdeCambodiaCameroonCanadaCaribbean small statesCentral African RepublicCentral Europe and the BalticsChadChannel IslandsChileChinaColombiaComorosCongo, Dem. Rep.Congo, Rep.Costa RicaCote d'IvoireCroatiaCubaCuracaoCyprusCzech RepublicDenmarkDjiboutiDominican RepublicEarly-demographic dividendEast Asia & PacificEast Asia & Pacific (excluding high income)East Asia & Pacific (IDA & IBRD countries)EcuadorEgypt, Arab Rep.El SalvadorEquatorial GuineaEritreaEstoniaEthiopiaEuro areaEurope & Central AsiaEurope & Central Asia (excluding high income)Europe & Central Asia (IDA & IBRD countries)European UnionFijiFinlandFragile and conflict affected situationsFranceFrench PolynesiaGabonGambia, TheGeorgiaGermanyGhanaGreeceGrenadaGuamGuatemalaGuineaGuinea-BissauGuyanaHaitiHeavily indebted poor countries (HIPC)High incomeHondurasHong Kong SAR, ChinaHungaryIBRD onlyIcelandIDA & IBRD totalIDA blendIDA onlyIDA totalIndiaIndonesiaIran, Islamic Rep.IraqIrelandIsraelItalyJamaicaJapanJordanKazakhstanKenyaKiribatiKorea, Dem. People’s Rep.Korea, Rep.KuwaitKyrgyz RepublicLao PDRLate-demographic dividendLatin America & Caribbean Latin America & Caribbean (excluding high income)Latin America & the Caribbean (IDA & IBRD countries)LatviaLeast developed countries: UN classificationLebanonLesothoLiberiaLibyaLithuaniaLow & middle incomeLow incomeLower middle incomeLuxembourgMacao SAR, ChinaMacedonia, FYRMadagascarMalawiMalaysiaMaldivesMaliMaltaMauritaniaMauritiusMexicoMicronesia, Fed. Sts.Middle East & North AfricaMiddle East & North Africa (excluding high income)Middle East & North Africa (IDA & IBRD countries)Middle incomeMoldovaMongoliaMontenegroMoroccoMozambiqueMyanmarNamibiaNepalNetherlandsNew CaledoniaNew ZealandNicaraguaNigerNigeriaNorth AmericaNorwayOECD membersOmanOther small statesPacific island small statesPakistanPanamaPapua New GuineaParaguayPeruPhilippinesPolandPortugalPost-demographic dividendPre-demographic dividendPuerto RicoQatarRomaniaRussian FederationRwandaSamoaSao Tome and PrincipeSaudi ArabiaSenegalSerbiaSeychellesSierra LeoneSingaporeSlovak RepublicSloveniaSmall statesSolomon IslandsSomaliaSouth AfricaSouth AsiaSouth Asia (IDA & IBRD)South SudanSpainSri LankaSt. LuciaSt. Vincent and the GrenadinesSub-Saharan Africa Sub-Saharan Africa (excluding high income)Sub-Saharan Africa (IDA & IBRD countries)SudanSurinameSwazilandSwedenSwitzerlandSyrian Arab RepublicTajikistanTanzaniaThailandTimor-LesteTogoTongaTrinidad and TobagoTunisiaTurkeyTurkmenistanUgandaUkraineUnited Arab EmiratesUnited KingdomUnited StatesUpper middle incomeUruguayUzbekistanVanuatuVenezuela, RBVietnamVirgin Islands (U.S.)West Bank and GazaWorldYemen, Rep.ZambiaZimbabwe Timeline:
This timeline shows a graph from 1961 to 2015 of Central Europe and the Baltics. No data until 1960. Number of actual observations by date: 55.
Source name:
World Development Indicators
Source organization:
United Nations Population Division. World Population Prospects. New York, United Nations, Department of Economic and Social Affairs (advanced Excel tables). Available at http://esa.un.org/wpp/unpp/panel_population.htm.
Categories, topics:
Health, Gender
Last updated:
apr 23, 2017
Indicators value changes by year
Minimum:
76.251
jan 1, 1961
Maximum:
88.325
jan 1, 2015
At the date of observation
Value
Absolute change
Change from previous value
jan 1, 1961
76.251
+76.251
0.0%
jan 1, 1962
77.191
+0.94
1.23%
jan 1, 1963
78.13
+0.939
1.22%
jan 1, 1964
78.42
+0.29
0.37%
jan 1, 1965
78.712
+0.292
0.37%
jan 1, 1966
79.005
+0.293
0.37%
jan 1, 1967
79.294
+0.289
0.37%
jan 1, 1968
79.582
+0.288
0.36%
jan 1, 1969
79.808
+0.225
0.28%
jan 1, 1970
80.034
+0.227
0.28%
jan 1, 1971
80.258
+0.223
0.28%
jan 1, 1972
80.487
+0.229
0.29%
jan 1, 1973
80.717
+0.23
0.29%
jan 1, 1974
80.839
+0.122
0.15%
jan 1, 1975
80.961
+0.123
0.15%
jan 1, 1976
81.084
+0.122
0.15%
jan 1, 1977
81.205
+0.121
0.15%
jan 1, 1978
81.329
+0.125
0.15%
jan 1, 1979
81.357
+0.028
0.03%
jan 1, 1980
81.385
+0.028
0.03%
jan 1, 1981
81.41
+0.025
0.03%
jan 1, 1982
81.434
+0.024
0.03%
jan 1, 1983
81.456
+0.022
0.03%
jan 1, 1984
81.541
+0.085
0.1%
jan 1, 1985
81.627
+0.085
0.1%
jan 1, 1986
81.713
+0.086
0.11%
jan 1, 1987
81.799
+0.086
0.1%
jan 1, 1988
81.887
+0.088
0.11%
jan 1, 1989
81.978
+0.091
0.11%
jan 1, 1990
82.07
+0.092
0.11%
jan 1, 1991
82.161
+0.091
0.11%
jan 1, 1992
82.249
+0.088
0.11%
jan 1, 1993
82.344
+0.095
0.12%
jan 1, 1994
82.613
+0.269
0.33%
jan 1, 1995
82.878
+0.265
0.32%
jan 1, 1996
83.145
+0.267
0.32%
jan 1, 1997
83.403
+0.259
0.31%
jan 1, 1998
83.675
+0.271
0.33%
jan 1, 1999
84.024
+0.349
0.42%
jan 1, 2000
84.376
+0.352
0.42%
jan 1, 2001
84.714
+0.338
0.4%
jan 1, 2002
85.074
+0.36
0.42%
jan 1, 2003
85.434
+0.36
0.42%
jan 1, 2004
85.731
+0.297
0.35%
jan 1, 2005
86.027
+0.296
0.35%
jan 1, 2006
86.325
+0.298
0.35%
jan 1, 2007
86.623
+0.298
0.35%
jan 1, 2008
86.927
+0.304
0.35%
jan 1, 2009
87.161
+0.235
0.27%
jan 1, 2010
87.391
+0.23
0.26%
jan 1, 2011
87.617
+0.226
0.26%
jan 1, 2012
87.838
+0.221
0.25%
jan 1, 2013
88.059
+0.222
0.25%
jan 1, 2014
88.192
+0.133
0.15%
jan 1, 2015
88.325
+0.133
0.15%
Ranking of countries by current statistics by years


Comments: