29
/
en
AIzaSyAYiBZKx7MnpbEhh9jyipgxe19OcubqV5w
April 1, 2024
30325
Euro area
EMU
false
2
1
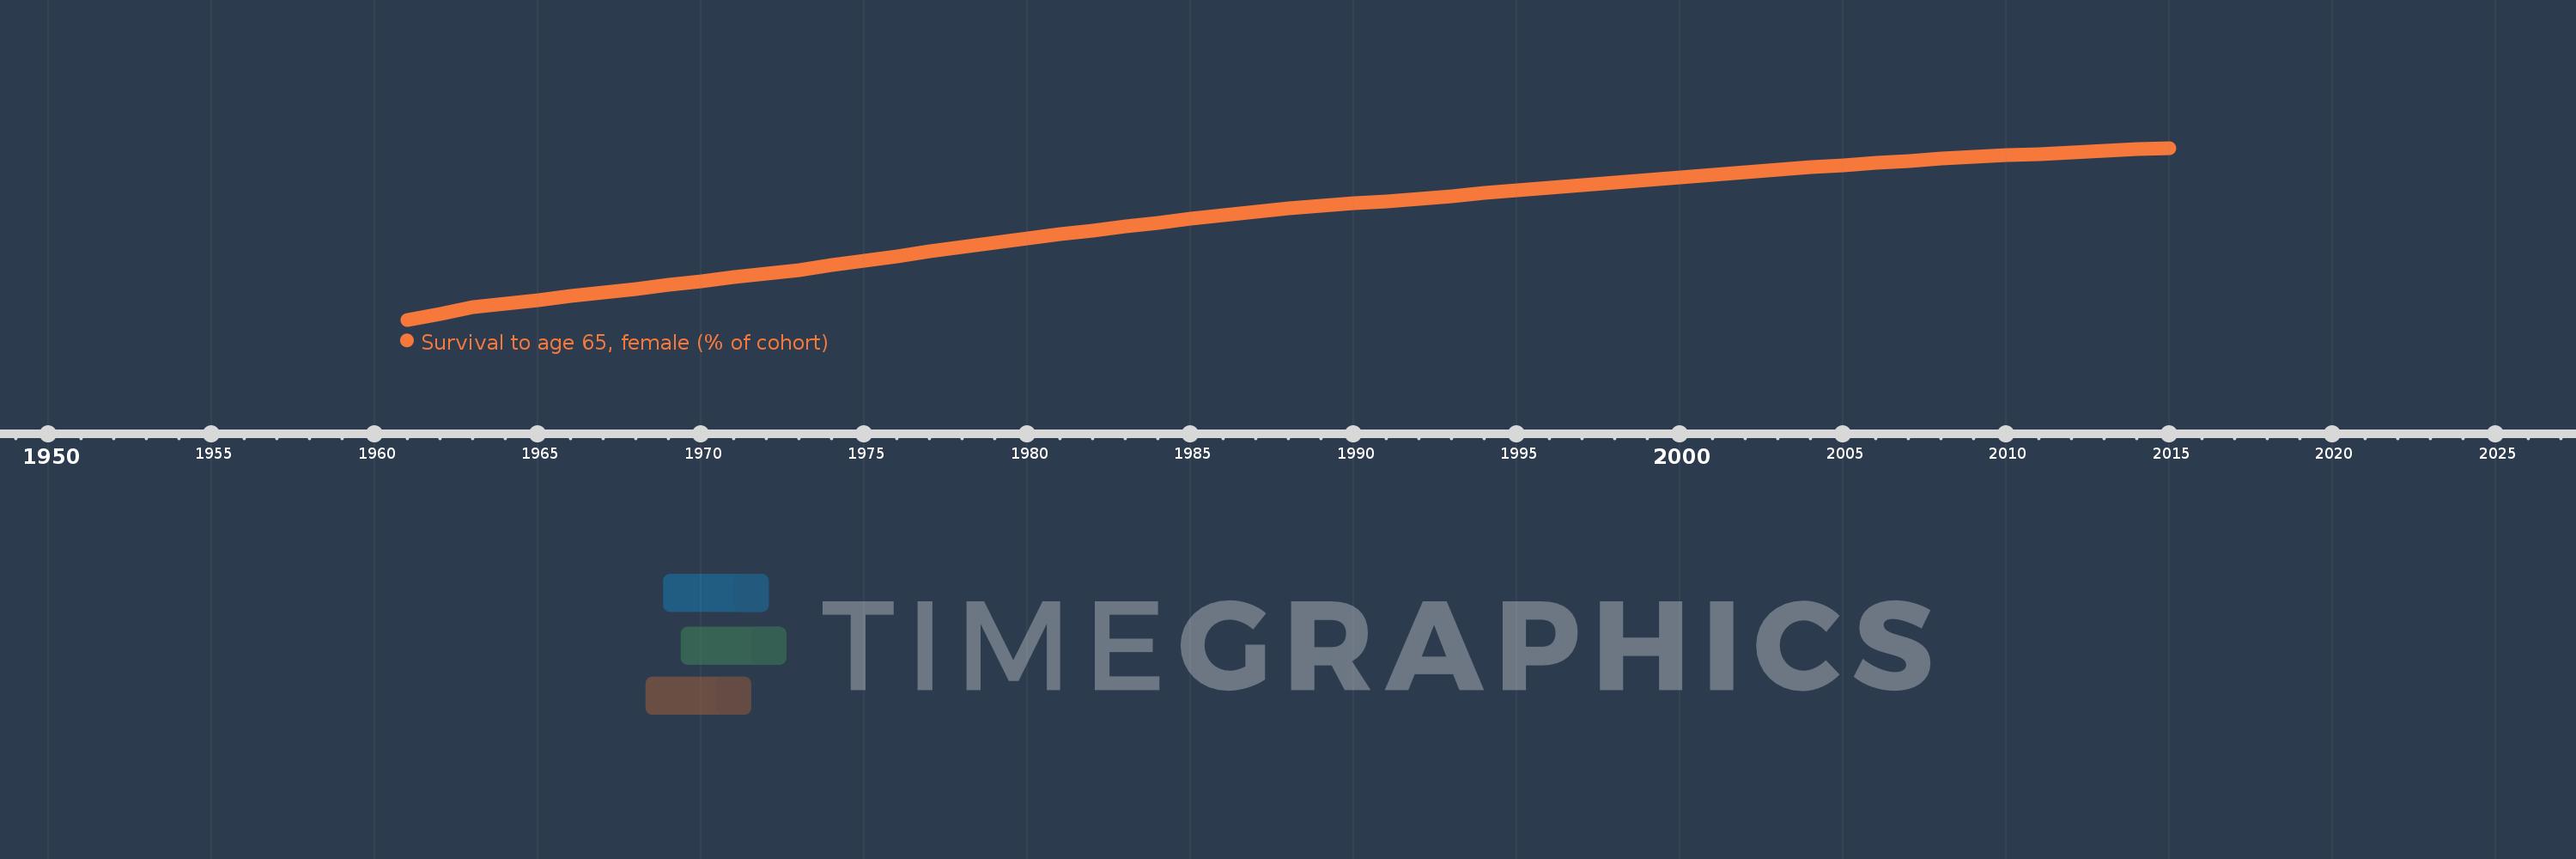
Survival to age 65, female (% of cohort)
2015,2014,2013,2012,2011,2010,2009,2008,2007,2006,2005,2004,2003,2002,2001,2000,1999,1998,1997,1996,1995,1994,1993,1992,1991,1990,1989,1988,1987,1986,1985,1984,1983,1982,1981,1980,1979,1978,1977,1976,1975,1974,1973,1972,1971,1970,1969,1968,1967,1966,1965,1964,1963,1962,1961
This statistics in other country:
AfghanistanAlbaniaAlgeriaAngolaAntigua and BarbudaArab WorldArgentinaArmeniaArubaAustraliaAustriaAzerbaijanBahamas, TheBahrainBangladeshBarbadosBelarusBelgiumBelizeBeninBhutanBoliviaBosnia and HerzegovinaBotswanaBrazilBrunei DarussalamBulgariaBurkina FasoBurundiCabo VerdeCambodiaCameroonCanadaCaribbean small statesCentral African RepublicCentral Europe and the BalticsChadChannel IslandsChileChinaColombiaComorosCongo, Dem. Rep.Congo, Rep.Costa RicaCote d'IvoireCroatiaCubaCuracaoCyprusCzech RepublicDenmarkDjiboutiDominican RepublicEarly-demographic dividendEast Asia & PacificEast Asia & Pacific (excluding high income)East Asia & Pacific (IDA & IBRD countries)EcuadorEgypt, Arab Rep.El SalvadorEquatorial GuineaEritreaEstoniaEthiopiaEuro areaEurope & Central AsiaEurope & Central Asia (excluding high income)Europe & Central Asia (IDA & IBRD countries)European UnionFijiFinlandFragile and conflict affected situationsFranceFrench PolynesiaGabonGambia, TheGeorgiaGermanyGhanaGreeceGrenadaGuamGuatemalaGuineaGuinea-BissauGuyanaHaitiHeavily indebted poor countries (HIPC)High incomeHondurasHong Kong SAR, ChinaHungaryIBRD onlyIcelandIDA & IBRD totalIDA blendIDA onlyIDA totalIndiaIndonesiaIran, Islamic Rep.IraqIrelandIsraelItalyJamaicaJapanJordanKazakhstanKenyaKiribatiKorea, Dem. People’s Rep.Korea, Rep.KuwaitKyrgyz RepublicLao PDRLate-demographic dividendLatin America & Caribbean Latin America & Caribbean (excluding high income)Latin America & the Caribbean (IDA & IBRD countries)LatviaLeast developed countries: UN classificationLebanonLesothoLiberiaLibyaLithuaniaLow & middle incomeLow incomeLower middle incomeLuxembourgMacao SAR, ChinaMacedonia, FYRMadagascarMalawiMalaysiaMaldivesMaliMaltaMauritaniaMauritiusMexicoMicronesia, Fed. Sts.Middle East & North AfricaMiddle East & North Africa (excluding high income)Middle East & North Africa (IDA & IBRD countries)Middle incomeMoldovaMongoliaMontenegroMoroccoMozambiqueMyanmarNamibiaNepalNetherlandsNew CaledoniaNew ZealandNicaraguaNigerNigeriaNorth AmericaNorwayOECD membersOmanOther small statesPacific island small statesPakistanPanamaPapua New GuineaParaguayPeruPhilippinesPolandPortugalPost-demographic dividendPre-demographic dividendPuerto RicoQatarRomaniaRussian FederationRwandaSamoaSao Tome and PrincipeSaudi ArabiaSenegalSerbiaSeychellesSierra LeoneSingaporeSlovak RepublicSloveniaSmall statesSolomon IslandsSomaliaSouth AfricaSouth AsiaSouth Asia (IDA & IBRD)South SudanSpainSri LankaSt. LuciaSt. Vincent and the GrenadinesSub-Saharan Africa Sub-Saharan Africa (excluding high income)Sub-Saharan Africa (IDA & IBRD countries)SudanSurinameSwazilandSwedenSwitzerlandSyrian Arab RepublicTajikistanTanzaniaThailandTimor-LesteTogoTongaTrinidad and TobagoTunisiaTurkeyTurkmenistanUgandaUkraineUnited Arab EmiratesUnited KingdomUnited StatesUpper middle incomeUruguayUzbekistanVanuatuVenezuela, RBVietnamVirgin Islands (U.S.)West Bank and GazaWorldYemen, Rep.ZambiaZimbabwe Timeline:
This timeline shows a graph from 1961 to 2015 of Euro area. No data until 1960. Number of actual observations by date: 55.
Source name:
World Development Indicators
Source organization:
United Nations Population Division. World Population Prospects. New York, United Nations, Department of Economic and Social Affairs (advanced Excel tables). Available at http://esa.un.org/wpp/unpp/panel_population.htm.
Categories, topics:
Health, Gender
Last updated:
apr 23, 2017
Indicators value changes by year
Maximum:
92.533
jan 1, 2015
At the date of observation
Value
Absolute change
Change from previous value
jan 1, 1961
79.09
+79.09
0.0%
jan 1, 1962
79.572
+0.481
0.61%
jan 1, 1963
80.055
+0.484
0.61%
jan 1, 1964
80.348
+0.293
0.37%
jan 1, 1965
80.641
+0.293
0.37%
jan 1, 1966
80.935
+0.293
0.36%
jan 1, 1967
81.228
+0.293
0.36%
jan 1, 1968
81.52
+0.292
0.36%
jan 1, 1969
81.813
+0.292
0.36%
jan 1, 1970
82.105
+0.292
0.36%
jan 1, 1971
82.398
+0.293
0.36%
jan 1, 1972
82.691
+0.293
0.36%
jan 1, 1973
82.983
+0.291
0.35%
jan 1, 1974
83.343
+0.36
0.43%
jan 1, 1975
83.702
+0.359
0.43%
jan 1, 1976
84.061
+0.358
0.43%
jan 1, 1977
84.419
+0.359
0.43%
jan 1, 1978
84.78
+0.361
0.43%
jan 1, 1979
85.109
+0.329
0.39%
jan 1, 1980
85.437
+0.328
0.39%
jan 1, 1981
85.763
+0.327
0.38%
jan 1, 1982
86.091
+0.327
0.38%
jan 1, 1983
86.417
+0.327
0.38%
jan 1, 1984
86.693
+0.275
0.32%
jan 1, 1985
86.968
+0.276
0.32%
jan 1, 1986
87.245
+0.277
0.32%
jan 1, 1987
87.521
+0.276
0.32%
jan 1, 1988
87.797
+0.276
0.32%
jan 1, 1989
87.992
+0.194
0.22%
jan 1, 1990
88.185
+0.194
0.22%
jan 1, 1991
88.379
+0.194
0.22%
jan 1, 1992
88.574
+0.195
0.22%
jan 1, 1993
88.771
+0.197
0.22%
jan 1, 1994
88.99
+0.219
0.25%
jan 1, 1995
89.209
+0.218
0.25%
jan 1, 1996
89.426
+0.217
0.24%
jan 1, 1997
89.642
+0.216
0.24%
jan 1, 1998
89.857
+0.216
0.24%
jan 1, 1999
90.055
+0.198
0.22%
jan 1, 2000
90.252
+0.197
0.22%
jan 1, 2001
90.449
+0.197
0.22%
jan 1, 2002
90.648
+0.2
0.22%
jan 1, 2003
90.848
+0.2
0.22%
jan 1, 2004
91.019
+0.171
0.19%
jan 1, 2005
91.192
+0.173
0.19%
jan 1, 2006
91.365
+0.173
0.19%
jan 1, 2007
91.538
+0.173
0.19%
jan 1, 2008
91.712
+0.174
0.19%
jan 1, 2009
91.833
+0.121
0.13%
jan 1, 2010
91.952
+0.119
0.13%
jan 1, 2011
92.071
+0.118
0.13%
jan 1, 2012
92.187
+0.117
0.13%
jan 1, 2013
92.305
+0.118
0.13%
jan 1, 2014
92.417
+0.112
0.12%
jan 1, 2015
92.533
+0.116
0.13%
Ranking of countries by current statistics by years


Comments: