29
/
en
AIzaSyAYiBZKx7MnpbEhh9jyipgxe19OcubqV5w
April 1, 2024
138795
Georgia
GEO
true
2
1
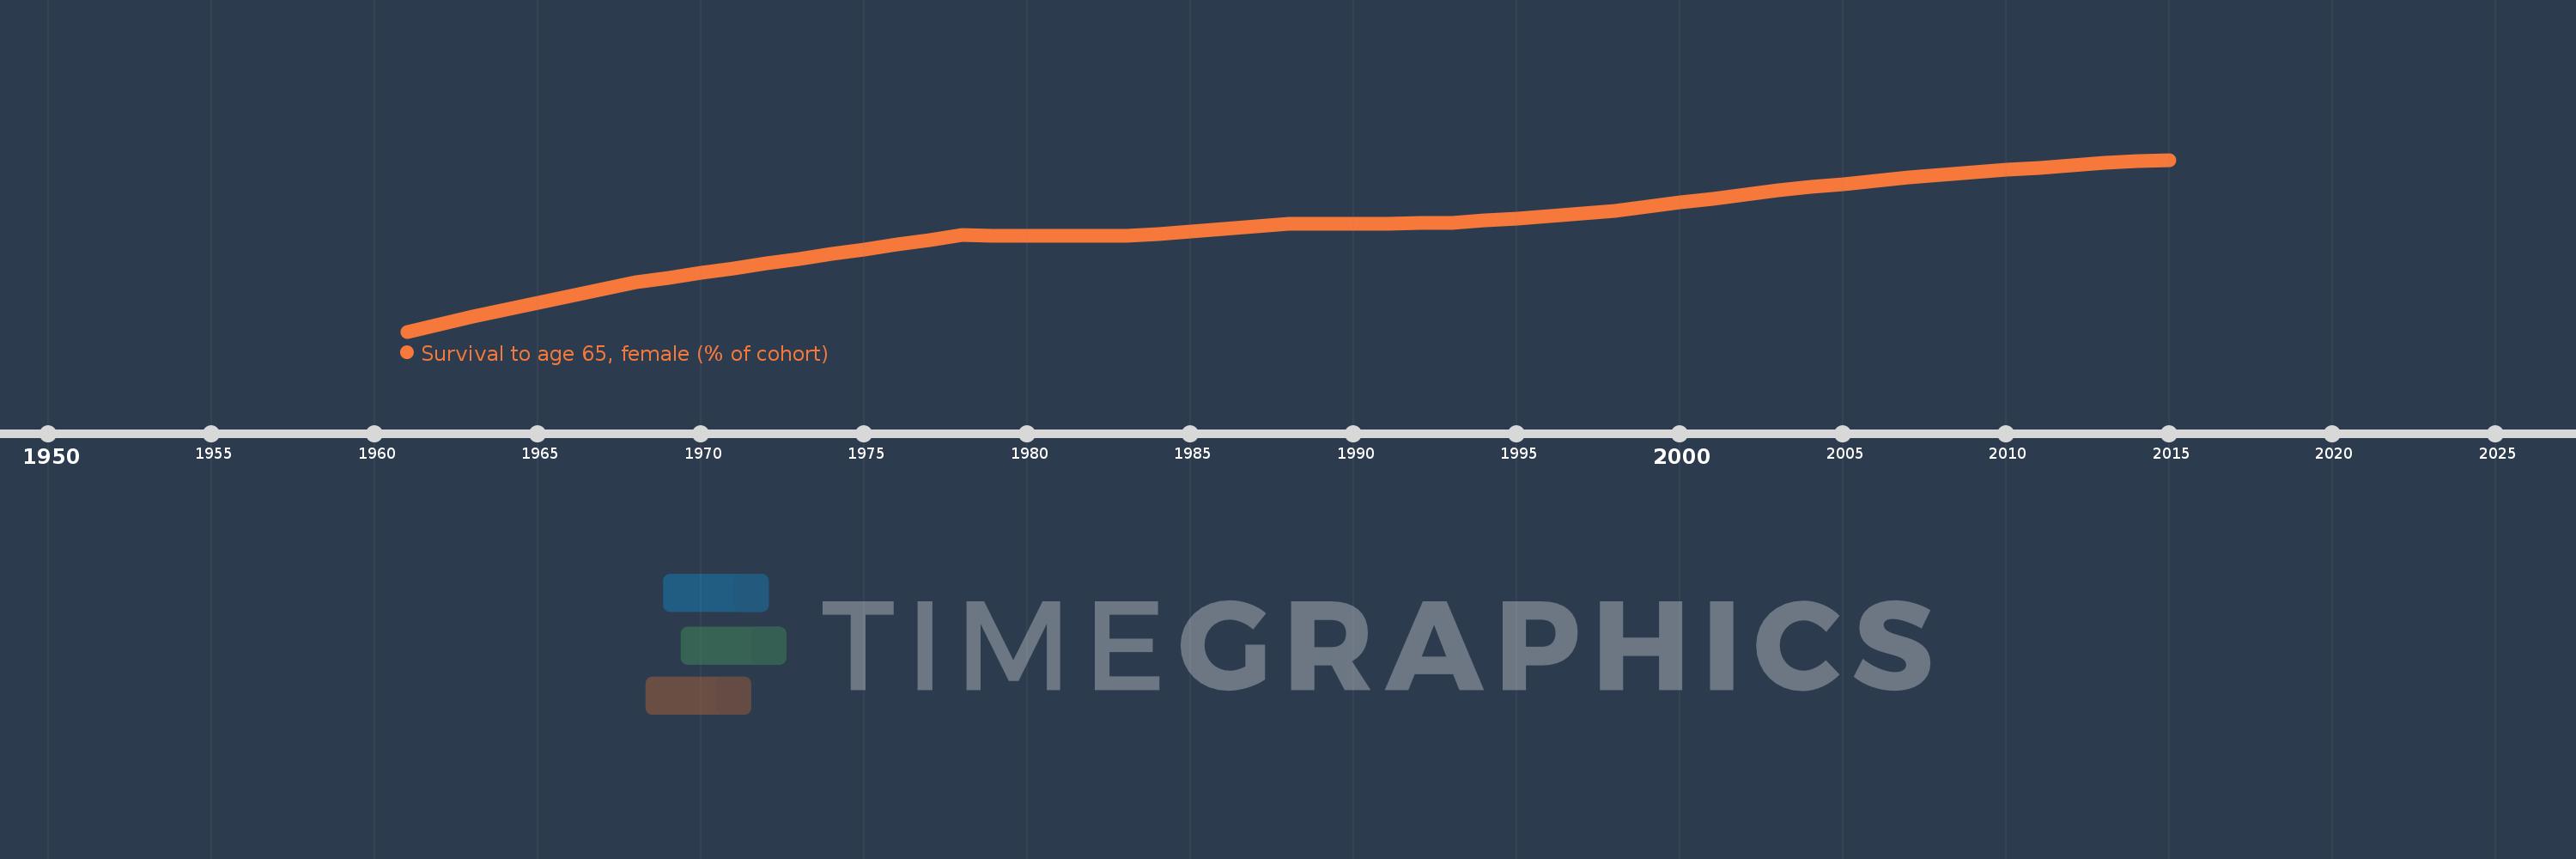
Survival to age 65, female (% of cohort)
2015,2014,2013,2012,2011,2010,2009,2008,2007,2006,2005,2004,2003,2002,2001,2000,1999,1998,1997,1996,1995,1994,1993,1992,1991,1990,1989,1988,1987,1986,1985,1984,1983,1982,1981,1980,1979,1978,1977,1976,1975,1974,1973,1972,1971,1970,1969,1968,1967,1966,1965,1964,1963,1962,1961
This statistics in other country:
AfghanistanAlbaniaAlgeriaAngolaAntigua and BarbudaArab WorldArgentinaArmeniaArubaAustraliaAustriaAzerbaijanBahamas, TheBahrainBangladeshBarbadosBelarusBelgiumBelizeBeninBhutanBoliviaBosnia and HerzegovinaBotswanaBrazilBrunei DarussalamBulgariaBurkina FasoBurundiCabo VerdeCambodiaCameroonCanadaCaribbean small statesCentral African RepublicCentral Europe and the BalticsChadChannel IslandsChileChinaColombiaComorosCongo, Dem. Rep.Congo, Rep.Costa RicaCote d'IvoireCroatiaCubaCuracaoCyprusCzech RepublicDenmarkDjiboutiDominican RepublicEarly-demographic dividendEast Asia & PacificEast Asia & Pacific (excluding high income)East Asia & Pacific (IDA & IBRD countries)EcuadorEgypt, Arab Rep.El SalvadorEquatorial GuineaEritreaEstoniaEthiopiaEuro areaEurope & Central AsiaEurope & Central Asia (excluding high income)Europe & Central Asia (IDA & IBRD countries)European UnionFijiFinlandFragile and conflict affected situationsFranceFrench PolynesiaGabonGambia, TheGeorgiaGermanyGhanaGreeceGrenadaGuamGuatemalaGuineaGuinea-BissauGuyanaHaitiHeavily indebted poor countries (HIPC)High incomeHondurasHong Kong SAR, ChinaHungaryIBRD onlyIcelandIDA & IBRD totalIDA blendIDA onlyIDA totalIndiaIndonesiaIran, Islamic Rep.IraqIrelandIsraelItalyJamaicaJapanJordanKazakhstanKenyaKiribatiKorea, Dem. People’s Rep.Korea, Rep.KuwaitKyrgyz RepublicLao PDRLate-demographic dividendLatin America & Caribbean Latin America & Caribbean (excluding high income)Latin America & the Caribbean (IDA & IBRD countries)LatviaLeast developed countries: UN classificationLebanonLesothoLiberiaLibyaLithuaniaLow & middle incomeLow incomeLower middle incomeLuxembourgMacao SAR, ChinaMacedonia, FYRMadagascarMalawiMalaysiaMaldivesMaliMaltaMauritaniaMauritiusMexicoMicronesia, Fed. Sts.Middle East & North AfricaMiddle East & North Africa (excluding high income)Middle East & North Africa (IDA & IBRD countries)Middle incomeMoldovaMongoliaMontenegroMoroccoMozambiqueMyanmarNamibiaNepalNetherlandsNew CaledoniaNew ZealandNicaraguaNigerNigeriaNorth AmericaNorwayOECD membersOmanOther small statesPacific island small statesPakistanPanamaPapua New GuineaParaguayPeruPhilippinesPolandPortugalPost-demographic dividendPre-demographic dividendPuerto RicoQatarRomaniaRussian FederationRwandaSamoaSao Tome and PrincipeSaudi ArabiaSenegalSerbiaSeychellesSierra LeoneSingaporeSlovak RepublicSloveniaSmall statesSolomon IslandsSomaliaSouth AfricaSouth AsiaSouth Asia (IDA & IBRD)South SudanSpainSri LankaSt. LuciaSt. Vincent and the GrenadinesSub-Saharan Africa Sub-Saharan Africa (excluding high income)Sub-Saharan Africa (IDA & IBRD countries)SudanSurinameSwazilandSwedenSwitzerlandSyrian Arab RepublicTajikistanTanzaniaThailandTimor-LesteTogoTongaTrinidad and TobagoTunisiaTurkeyTurkmenistanUgandaUkraineUnited Arab EmiratesUnited KingdomUnited StatesUpper middle incomeUruguayUzbekistanVanuatuVenezuela, RBVietnamVirgin Islands (U.S.)West Bank and GazaWorldYemen, Rep.ZambiaZimbabwe Timeline:
This timeline shows a graph from 1961 to 2015 of Georgia. No data until 1960. Number of actual observations by date: 55.
Source name:
World Development Indicators
Source organization:
United Nations Population Division. World Population Prospects. New York, United Nations, Department of Economic and Social Affairs (advanced Excel tables). Available at http://esa.un.org/wpp/unpp/panel_population.htm.
Categories, topics:
Health, Gender
Last updated:
apr 23, 2017
Indicators value changes by year
Minimum:
72.633
jan 1, 1961
At the date of observation
Value
Absolute change
Change from previous value
jan 1, 1961
72.633
+72.633
0.0%
jan 1, 1962
73.318
+0.686
0.94%
jan 1, 1963
74.004
+0.686
0.94%
jan 1, 1964
74.616
+0.612
0.83%
jan 1, 1965
75.227
+0.612
0.82%
jan 1, 1966
75.839
+0.612
0.81%
jan 1, 1967
76.45
+0.612
0.81%
jan 1, 1968
77.062
+0.612
0.8%
jan 1, 1969
77.492
+0.43
0.56%
jan 1, 1970
77.922
+0.43
0.56%
jan 1, 1971
78.352
+0.43
0.55%
jan 1, 1972
78.783
+0.43
0.55%
jan 1, 1973
79.213
+0.43
0.55%
jan 1, 1974
79.639
+0.426
0.54%
jan 1, 1975
80.065
+0.426
0.53%
jan 1, 1976
80.49
+0.426
0.53%
jan 1, 1977
80.916
+0.426
0.53%
jan 1, 1978
81.342
+0.426
0.53%
jan 1, 1979
81.325
-0.017
-0.02%
jan 1, 1980
81.309
-0.017
-0.02%
jan 1, 1981
81.292
-0.017
-0.02%
jan 1, 1982
81.275
-0.017
-0.02%
jan 1, 1983
81.259
-0.017
-0.02%
jan 1, 1984
81.484
+0.226
0.28%
jan 1, 1985
81.71
+0.226
0.28%
jan 1, 1986
81.935
+0.226
0.28%
jan 1, 1987
82.161
+0.226
0.28%
jan 1, 1988
82.387
+0.226
0.27%
jan 1, 1989
82.397
+0.01
0.01%
jan 1, 1990
82.407
+0.01
0.01%
jan 1, 1991
82.417
+0.01
0.01%
jan 1, 1992
82.427
+0.01
0.01%
jan 1, 1993
82.437
+0.01
0.01%
jan 1, 1994
82.656
+0.22
0.27%
jan 1, 1995
82.876
+0.22
0.27%
jan 1, 1996
83.096
+0.22
0.27%
jan 1, 1997
83.316
+0.22
0.26%
jan 1, 1998
83.535
+0.22
0.26%
jan 1, 1999
83.914
+0.379
0.45%
jan 1, 2000
84.293
+0.379
0.45%
jan 1, 2001
84.672
+0.379
0.45%
jan 1, 2002
85.051
+0.379
0.45%
jan 1, 2003
85.429
+0.379
0.45%
jan 1, 2004
85.708
+0.279
0.33%
jan 1, 2005
85.986
+0.279
0.33%
jan 1, 2006
86.265
+0.279
0.32%
jan 1, 2007
86.544
+0.279
0.32%
jan 1, 2008
86.822
+0.279
0.32%
jan 1, 2009
87.032
+0.21
0.24%
jan 1, 2010
87.242
+0.21
0.24%
jan 1, 2011
87.452
+0.21
0.24%
jan 1, 2012
87.662
+0.21
0.24%
jan 1, 2013
87.873
+0.21
0.24%
jan 1, 2014
88.021
+0.149
0.17%
jan 1, 2015
88.17
+0.149
0.17%
Ranking of countries by current statistics by years


Comments: