29
/
en
AIzaSyAYiBZKx7MnpbEhh9jyipgxe19OcubqV5w
April 1, 2024
143594
Grenada
GRD
true
2
1
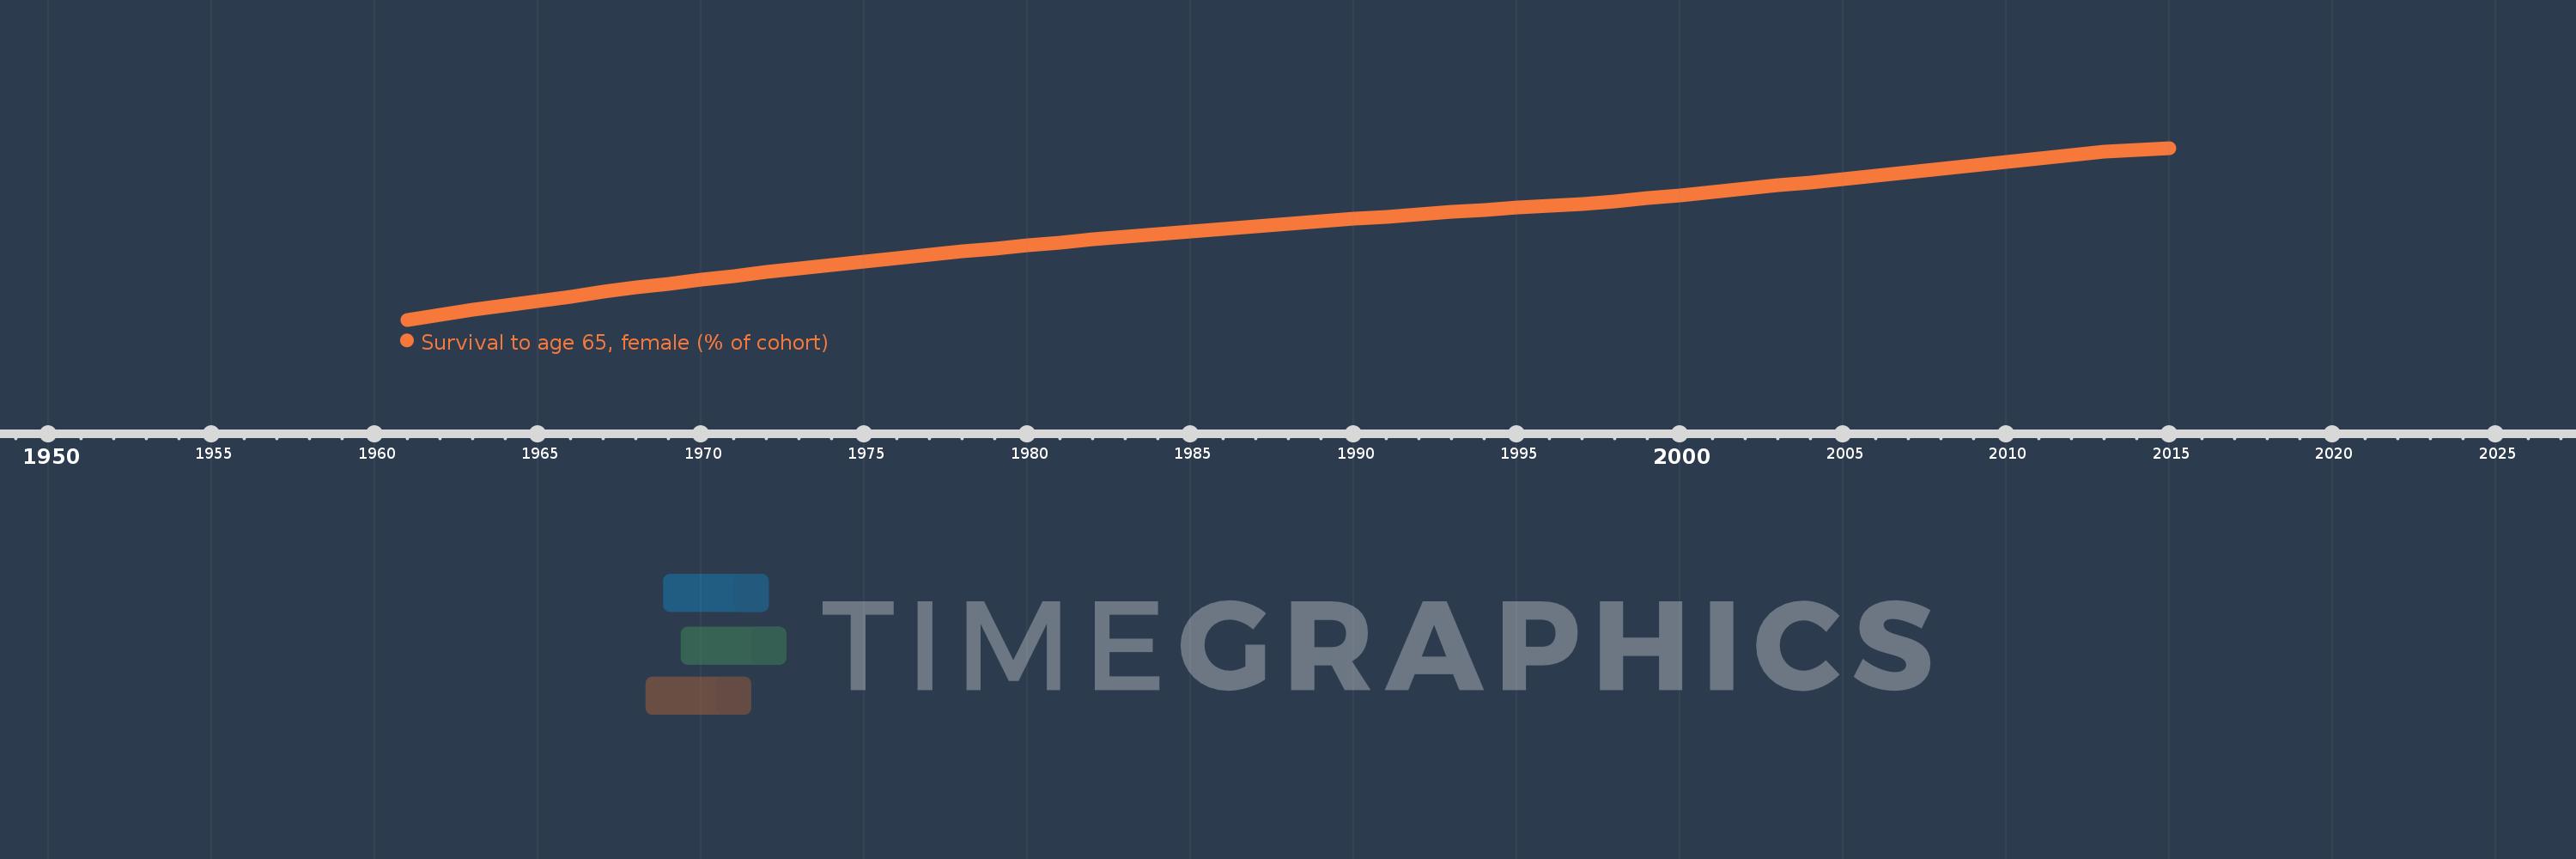
Survival to age 65, female (% of cohort)
2015,2014,2013,2012,2011,2010,2009,2008,2007,2006,2005,2004,2003,2002,2001,2000,1999,1998,1997,1996,1995,1994,1993,1992,1991,1990,1989,1988,1987,1986,1985,1984,1983,1982,1981,1980,1979,1978,1977,1976,1975,1974,1973,1972,1971,1970,1969,1968,1967,1966,1965,1964,1963,1962,1961
This statistics in other country:
AfghanistanAlbaniaAlgeriaAngolaAntigua and BarbudaArab WorldArgentinaArmeniaArubaAustraliaAustriaAzerbaijanBahamas, TheBahrainBangladeshBarbadosBelarusBelgiumBelizeBeninBhutanBoliviaBosnia and HerzegovinaBotswanaBrazilBrunei DarussalamBulgariaBurkina FasoBurundiCabo VerdeCambodiaCameroonCanadaCaribbean small statesCentral African RepublicCentral Europe and the BalticsChadChannel IslandsChileChinaColombiaComorosCongo, Dem. Rep.Congo, Rep.Costa RicaCote d'IvoireCroatiaCubaCuracaoCyprusCzech RepublicDenmarkDjiboutiDominican RepublicEarly-demographic dividendEast Asia & PacificEast Asia & Pacific (excluding high income)East Asia & Pacific (IDA & IBRD countries)EcuadorEgypt, Arab Rep.El SalvadorEquatorial GuineaEritreaEstoniaEthiopiaEuro areaEurope & Central AsiaEurope & Central Asia (excluding high income)Europe & Central Asia (IDA & IBRD countries)European UnionFijiFinlandFragile and conflict affected situationsFranceFrench PolynesiaGabonGambia, TheGeorgiaGermanyGhanaGreeceGrenadaGuamGuatemalaGuineaGuinea-BissauGuyanaHaitiHeavily indebted poor countries (HIPC)High incomeHondurasHong Kong SAR, ChinaHungaryIBRD onlyIcelandIDA & IBRD totalIDA blendIDA onlyIDA totalIndiaIndonesiaIran, Islamic Rep.IraqIrelandIsraelItalyJamaicaJapanJordanKazakhstanKenyaKiribatiKorea, Dem. People’s Rep.Korea, Rep.KuwaitKyrgyz RepublicLao PDRLate-demographic dividendLatin America & Caribbean Latin America & Caribbean (excluding high income)Latin America & the Caribbean (IDA & IBRD countries)LatviaLeast developed countries: UN classificationLebanonLesothoLiberiaLibyaLithuaniaLow & middle incomeLow incomeLower middle incomeLuxembourgMacao SAR, ChinaMacedonia, FYRMadagascarMalawiMalaysiaMaldivesMaliMaltaMauritaniaMauritiusMexicoMicronesia, Fed. Sts.Middle East & North AfricaMiddle East & North Africa (excluding high income)Middle East & North Africa (IDA & IBRD countries)Middle incomeMoldovaMongoliaMontenegroMoroccoMozambiqueMyanmarNamibiaNepalNetherlandsNew CaledoniaNew ZealandNicaraguaNigerNigeriaNorth AmericaNorwayOECD membersOmanOther small statesPacific island small statesPakistanPanamaPapua New GuineaParaguayPeruPhilippinesPolandPortugalPost-demographic dividendPre-demographic dividendPuerto RicoQatarRomaniaRussian FederationRwandaSamoaSao Tome and PrincipeSaudi ArabiaSenegalSerbiaSeychellesSierra LeoneSingaporeSlovak RepublicSloveniaSmall statesSolomon IslandsSomaliaSouth AfricaSouth AsiaSouth Asia (IDA & IBRD)South SudanSpainSri LankaSt. LuciaSt. Vincent and the GrenadinesSub-Saharan Africa Sub-Saharan Africa (excluding high income)Sub-Saharan Africa (IDA & IBRD countries)SudanSurinameSwazilandSwedenSwitzerlandSyrian Arab RepublicTajikistanTanzaniaThailandTimor-LesteTogoTongaTrinidad and TobagoTunisiaTurkeyTurkmenistanUgandaUkraineUnited Arab EmiratesUnited KingdomUnited StatesUpper middle incomeUruguayUzbekistanVanuatuVenezuela, RBVietnamVirgin Islands (U.S.)West Bank and GazaWorldYemen, Rep.ZambiaZimbabwe Timeline:
This timeline shows a graph from 1961 to 2015 of Grenada. No data until 1960. Number of actual observations by date: 55.
Source name:
World Development Indicators
Source organization:
United Nations Population Division. World Population Prospects. New York, United Nations, Department of Economic and Social Affairs (advanced Excel tables). Available at http://esa.un.org/wpp/unpp/panel_population.htm.
Categories, topics:
Health, Gender
Last updated:
apr 23, 2017
Indicators value changes by year
Minimum:
64.159
jan 1, 1961
Maximum:
83.647
jan 1, 2015
At the date of observation
Value
Absolute change
Change from previous value
jan 1, 1961
64.159
+64.159
0.0%
jan 1, 1962
64.732
+0.574
0.89%
jan 1, 1963
65.306
+0.574
0.89%
jan 1, 1964
65.807
+0.5
0.77%
jan 1, 1965
66.307
+0.5
0.76%
jan 1, 1966
66.807
+0.5
0.75%
jan 1, 1967
67.308
+0.5
0.75%
jan 1, 1968
67.808
+0.5
0.74%
jan 1, 1969
68.245
+0.437
0.64%
jan 1, 1970
68.682
+0.437
0.64%
jan 1, 1971
69.118
+0.437
0.64%
jan 1, 1972
69.555
+0.437
0.63%
jan 1, 1973
69.992
+0.437
0.63%
jan 1, 1974
70.374
+0.382
0.55%
jan 1, 1975
70.757
+0.382
0.54%
jan 1, 1976
71.139
+0.382
0.54%
jan 1, 1977
71.521
+0.382
0.54%
jan 1, 1978
71.904
+0.382
0.53%
jan 1, 1979
72.24
+0.336
0.47%
jan 1, 1980
72.576
+0.336
0.47%
jan 1, 1981
72.912
+0.336
0.46%
jan 1, 1982
73.248
+0.336
0.46%
jan 1, 1983
73.585
+0.336
0.46%
jan 1, 1984
73.881
+0.296
0.4%
jan 1, 1985
74.177
+0.296
0.4%
jan 1, 1986
74.473
+0.296
0.4%
jan 1, 1987
74.769
+0.296
0.4%
jan 1, 1988
75.065
+0.296
0.4%
jan 1, 1989
75.328
+0.263
0.35%
jan 1, 1990
75.59
+0.263
0.35%
jan 1, 1991
75.853
+0.263
0.35%
jan 1, 1992
76.116
+0.263
0.35%
jan 1, 1993
76.379
+0.263
0.35%
jan 1, 1994
76.613
+0.235
0.31%
jan 1, 1995
76.848
+0.235
0.31%
jan 1, 1996
77.083
+0.235
0.31%
jan 1, 1997
77.317
+0.235
0.3%
jan 1, 1998
77.552
+0.235
0.3%
jan 1, 1999
77.919
+0.368
0.47%
jan 1, 2000
78.287
+0.368
0.47%
jan 1, 2001
78.655
+0.368
0.47%
jan 1, 2002
79.022
+0.368
0.47%
jan 1, 2003
79.39
+0.368
0.47%
jan 1, 2004
79.766
+0.375
0.47%
jan 1, 2005
80.141
+0.375
0.47%
jan 1, 2006
80.516
+0.375
0.47%
jan 1, 2007
80.891
+0.375
0.47%
jan 1, 2008
81.267
+0.375
0.46%
jan 1, 2009
81.655
+0.388
0.48%
jan 1, 2010
82.043
+0.388
0.48%
jan 1, 2011
82.432
+0.388
0.47%
jan 1, 2012
82.82
+0.388
0.47%
jan 1, 2013
83.209
+0.388
0.47%
jan 1, 2014
83.428
+0.219
0.26%
jan 1, 2015
83.647
+0.219
0.26%
Ranking of countries by current statistics by years


Comments: