29
/
en
AIzaSyAYiBZKx7MnpbEhh9jyipgxe19OcubqV5w
April 1, 2024
190955
Mali
MLI
true
2
1
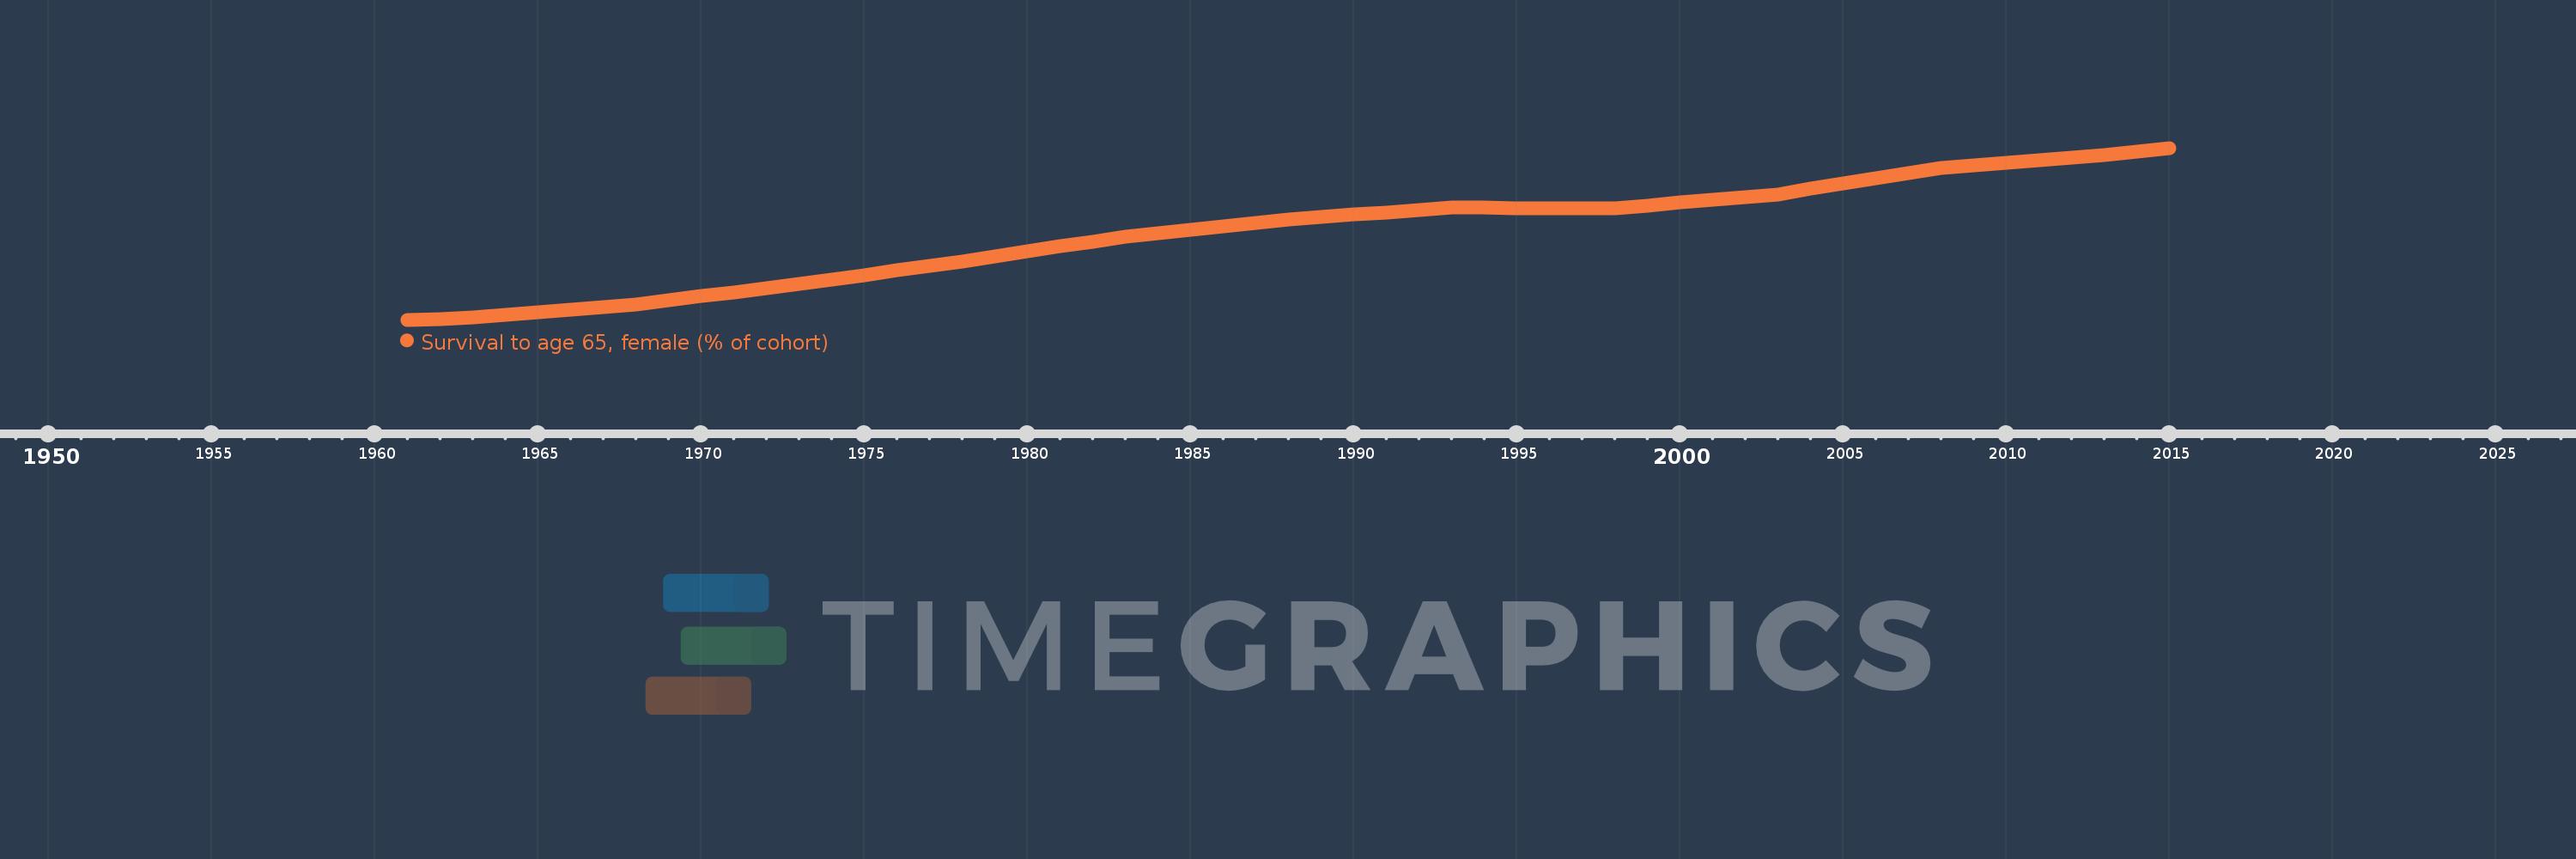
Survival to age 65, female (% of cohort)
2015,2014,2013,2012,2011,2010,2009,2008,2007,2006,2005,2004,2003,2002,2001,2000,1999,1998,1997,1996,1995,1994,1993,1992,1991,1990,1989,1988,1987,1986,1985,1984,1983,1982,1981,1980,1979,1978,1977,1976,1975,1974,1973,1972,1971,1970,1969,1968,1967,1966,1965,1964,1963,1962,1961
This statistics in other country:
AfghanistanAlbaniaAlgeriaAngolaAntigua and BarbudaArab WorldArgentinaArmeniaArubaAustraliaAustriaAzerbaijanBahamas, TheBahrainBangladeshBarbadosBelarusBelgiumBelizeBeninBhutanBoliviaBosnia and HerzegovinaBotswanaBrazilBrunei DarussalamBulgariaBurkina FasoBurundiCabo VerdeCambodiaCameroonCanadaCaribbean small statesCentral African RepublicCentral Europe and the BalticsChadChannel IslandsChileChinaColombiaComorosCongo, Dem. Rep.Congo, Rep.Costa RicaCote d'IvoireCroatiaCubaCuracaoCyprusCzech RepublicDenmarkDjiboutiDominican RepublicEarly-demographic dividendEast Asia & PacificEast Asia & Pacific (excluding high income)East Asia & Pacific (IDA & IBRD countries)EcuadorEgypt, Arab Rep.El SalvadorEquatorial GuineaEritreaEstoniaEthiopiaEuro areaEurope & Central AsiaEurope & Central Asia (excluding high income)Europe & Central Asia (IDA & IBRD countries)European UnionFijiFinlandFragile and conflict affected situationsFranceFrench PolynesiaGabonGambia, TheGeorgiaGermanyGhanaGreeceGrenadaGuamGuatemalaGuineaGuinea-BissauGuyanaHaitiHeavily indebted poor countries (HIPC)High incomeHondurasHong Kong SAR, ChinaHungaryIBRD onlyIcelandIDA & IBRD totalIDA blendIDA onlyIDA totalIndiaIndonesiaIran, Islamic Rep.IraqIrelandIsraelItalyJamaicaJapanJordanKazakhstanKenyaKiribatiKorea, Dem. People’s Rep.Korea, Rep.KuwaitKyrgyz RepublicLao PDRLate-demographic dividendLatin America & Caribbean Latin America & Caribbean (excluding high income)Latin America & the Caribbean (IDA & IBRD countries)LatviaLeast developed countries: UN classificationLebanonLesothoLiberiaLibyaLithuaniaLow & middle incomeLow incomeLower middle incomeLuxembourgMacao SAR, ChinaMacedonia, FYRMadagascarMalawiMalaysiaMaldivesMaliMaltaMauritaniaMauritiusMexicoMicronesia, Fed. Sts.Middle East & North AfricaMiddle East & North Africa (excluding high income)Middle East & North Africa (IDA & IBRD countries)Middle incomeMoldovaMongoliaMontenegroMoroccoMozambiqueMyanmarNamibiaNepalNetherlandsNew CaledoniaNew ZealandNicaraguaNigerNigeriaNorth AmericaNorwayOECD membersOmanOther small statesPacific island small statesPakistanPanamaPapua New GuineaParaguayPeruPhilippinesPolandPortugalPost-demographic dividendPre-demographic dividendPuerto RicoQatarRomaniaRussian FederationRwandaSamoaSao Tome and PrincipeSaudi ArabiaSenegalSerbiaSeychellesSierra LeoneSingaporeSlovak RepublicSloveniaSmall statesSolomon IslandsSomaliaSouth AfricaSouth AsiaSouth Asia (IDA & IBRD)South SudanSpainSri LankaSt. LuciaSt. Vincent and the GrenadinesSub-Saharan Africa Sub-Saharan Africa (excluding high income)Sub-Saharan Africa (IDA & IBRD countries)SudanSurinameSwazilandSwedenSwitzerlandSyrian Arab RepublicTajikistanTanzaniaThailandTimor-LesteTogoTongaTrinidad and TobagoTunisiaTurkeyTurkmenistanUgandaUkraineUnited Arab EmiratesUnited KingdomUnited StatesUpper middle incomeUruguayUzbekistanVanuatuVenezuela, RBVietnamVirgin Islands (U.S.)West Bank and GazaWorldYemen, Rep.ZambiaZimbabwe Timeline:
This timeline shows a graph from 1961 to 2015 of Mali. No data until 1960. Number of actual observations by date: 55.
Source name:
World Development Indicators
Source organization:
United Nations Population Division. World Population Prospects. New York, United Nations, Department of Economic and Social Affairs (advanced Excel tables). Available at http://esa.un.org/wpp/unpp/panel_population.htm.
Categories, topics:
Health, Gender
Last updated:
apr 23, 2017
Indicators value changes by year
Minimum:
18.237
jan 1, 1961
Maximum:
56.678
jan 1, 2015
At the date of observation
Value
Absolute change
Change from previous value
jan 1, 1961
18.237
+18.237
0.0%
jan 1, 1962
18.461
+0.223
1.22%
jan 1, 1963
18.684
+0.223
1.21%
jan 1, 1964
19.282
+0.598
3.2%
jan 1, 1965
19.879
+0.598
3.1%
jan 1, 1966
20.477
+0.598
3.01%
jan 1, 1967
21.074
+0.598
2.92%
jan 1, 1968
21.672
+0.598
2.84%
jan 1, 1969
22.583
+0.911
4.2%
jan 1, 1970
23.494
+0.911
4.03%
jan 1, 1971
24.405
+0.911
3.88%
jan 1, 1972
25.316
+0.911
3.73%
jan 1, 1973
26.227
+0.911
3.6%
jan 1, 1974
27.237
+1.01
3.85%
jan 1, 1975
28.247
+1.01
3.71%
jan 1, 1976
29.258
+1.01
3.58%
jan 1, 1977
30.268
+1.01
3.45%
jan 1, 1978
31.278
+1.01
3.34%
jan 1, 1979
32.395
+1.117
3.57%
jan 1, 1980
33.513
+1.117
3.45%
jan 1, 1981
34.63
+1.117
3.33%
jan 1, 1982
35.747
+1.117
3.23%
jan 1, 1983
36.865
+1.117
3.13%
jan 1, 1984
37.636
+0.771
2.09%
jan 1, 1985
38.406
+0.771
2.05%
jan 1, 1986
39.177
+0.771
2.01%
jan 1, 1987
39.948
+0.771
1.97%
jan 1, 1988
40.718
+0.771
1.93%
jan 1, 1989
41.233
+0.515
1.26%
jan 1, 1990
41.748
+0.515
1.25%
jan 1, 1991
42.263
+0.515
1.23%
jan 1, 1992
42.778
+0.515
1.22%
jan 1, 1993
43.293
+0.515
1.2%
jan 1, 1994
43.268
-0.025
-0.06%
jan 1, 1995
43.243
-0.025
-0.06%
jan 1, 1996
43.218
-0.025
-0.06%
jan 1, 1997
43.193
-0.025
-0.06%
jan 1, 1998
43.168
-0.025
-0.06%
jan 1, 1999
43.8
+0.631
1.46%
jan 1, 2000
44.431
+0.631
1.44%
jan 1, 2001
45.063
+0.631
1.42%
jan 1, 2002
45.694
+0.631
1.4%
jan 1, 2003
46.325
+0.631
1.38%
jan 1, 2004
47.512
+1.186
2.56%
jan 1, 2005
48.698
+1.186
2.5%
jan 1, 2006
49.885
+1.186
2.44%
jan 1, 2007
51.071
+1.186
2.38%
jan 1, 2008
52.257
+1.186
2.32%
jan 1, 2009
52.833
+0.576
1.1%
jan 1, 2010
53.408
+0.575
1.09%
jan 1, 2011
53.984
+0.576
1.08%
jan 1, 2012
54.559
+0.575
1.07%
jan 1, 2013
55.135
+0.576
1.05%
jan 1, 2014
55.907
+0.772
1.4%
jan 1, 2015
56.678
+0.772
1.38%
Ranking of countries by current statistics by years


Comments: