29
/
en
AIzaSyAYiBZKx7MnpbEhh9jyipgxe19OcubqV5w
April 1, 2024
37818
IDA & IBRD total
IBT
false
2
1
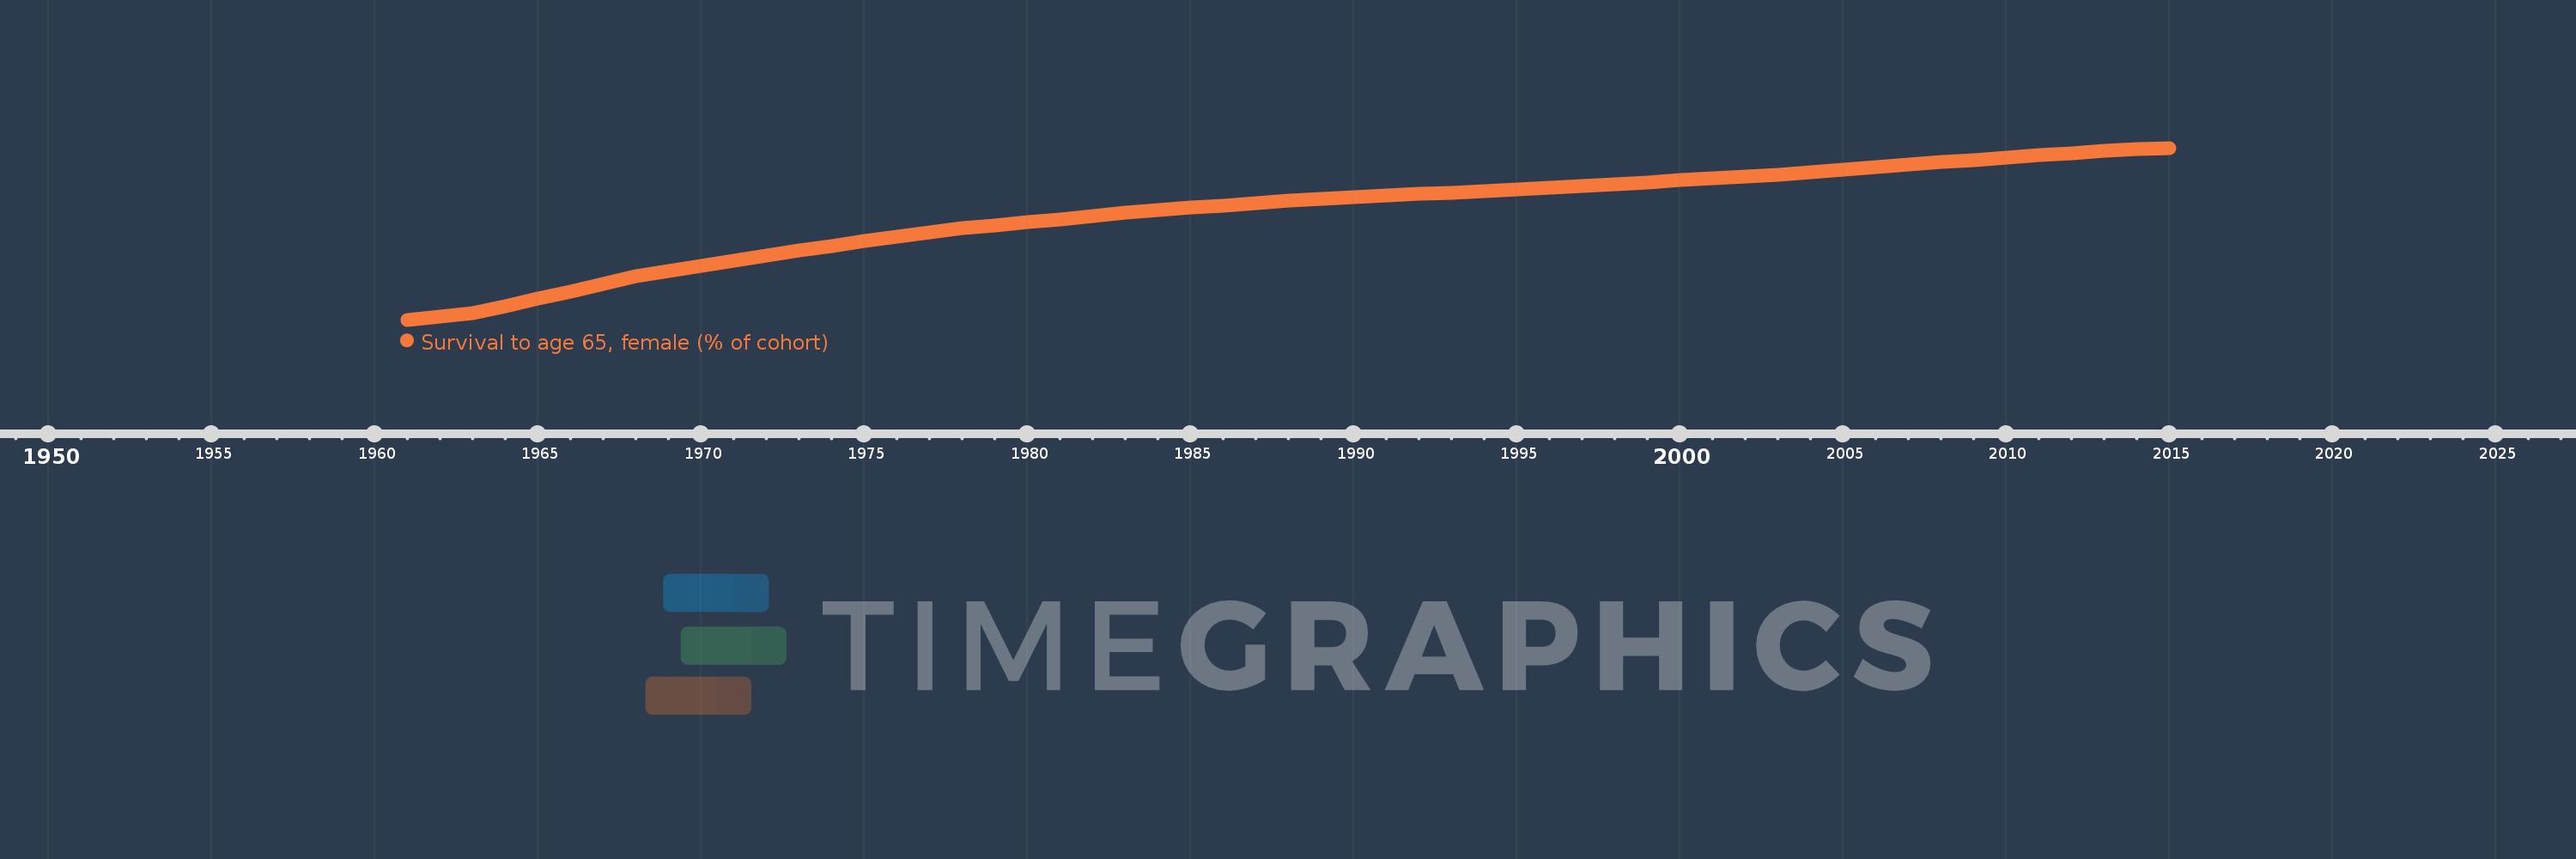
Survival to age 65, female (% of cohort)
2015,2014,2013,2012,2011,2010,2009,2008,2007,2006,2005,2004,2003,2002,2001,2000,1999,1998,1997,1996,1995,1994,1993,1992,1991,1990,1989,1988,1987,1986,1985,1984,1983,1982,1981,1980,1979,1978,1977,1976,1975,1974,1973,1972,1971,1970,1969,1968,1967,1966,1965,1964,1963,1962,1961
This statistics in other country:
AfghanistanAlbaniaAlgeriaAngolaAntigua and BarbudaArab WorldArgentinaArmeniaArubaAustraliaAustriaAzerbaijanBahamas, TheBahrainBangladeshBarbadosBelarusBelgiumBelizeBeninBhutanBoliviaBosnia and HerzegovinaBotswanaBrazilBrunei DarussalamBulgariaBurkina FasoBurundiCabo VerdeCambodiaCameroonCanadaCaribbean small statesCentral African RepublicCentral Europe and the BalticsChadChannel IslandsChileChinaColombiaComorosCongo, Dem. Rep.Congo, Rep.Costa RicaCote d'IvoireCroatiaCubaCuracaoCyprusCzech RepublicDenmarkDjiboutiDominican RepublicEarly-demographic dividendEast Asia & PacificEast Asia & Pacific (excluding high income)East Asia & Pacific (IDA & IBRD countries)EcuadorEgypt, Arab Rep.El SalvadorEquatorial GuineaEritreaEstoniaEthiopiaEuro areaEurope & Central AsiaEurope & Central Asia (excluding high income)Europe & Central Asia (IDA & IBRD countries)European UnionFijiFinlandFragile and conflict affected situationsFranceFrench PolynesiaGabonGambia, TheGeorgiaGermanyGhanaGreeceGrenadaGuamGuatemalaGuineaGuinea-BissauGuyanaHaitiHeavily indebted poor countries (HIPC)High incomeHondurasHong Kong SAR, ChinaHungaryIBRD onlyIcelandIDA & IBRD totalIDA blendIDA onlyIDA totalIndiaIndonesiaIran, Islamic Rep.IraqIrelandIsraelItalyJamaicaJapanJordanKazakhstanKenyaKiribatiKorea, Dem. People’s Rep.Korea, Rep.KuwaitKyrgyz RepublicLao PDRLate-demographic dividendLatin America & Caribbean Latin America & Caribbean (excluding high income)Latin America & the Caribbean (IDA & IBRD countries)LatviaLeast developed countries: UN classificationLebanonLesothoLiberiaLibyaLithuaniaLow & middle incomeLow incomeLower middle incomeLuxembourgMacao SAR, ChinaMacedonia, FYRMadagascarMalawiMalaysiaMaldivesMaliMaltaMauritaniaMauritiusMexicoMicronesia, Fed. Sts.Middle East & North AfricaMiddle East & North Africa (excluding high income)Middle East & North Africa (IDA & IBRD countries)Middle incomeMoldovaMongoliaMontenegroMoroccoMozambiqueMyanmarNamibiaNepalNetherlandsNew CaledoniaNew ZealandNicaraguaNigerNigeriaNorth AmericaNorwayOECD membersOmanOther small statesPacific island small statesPakistanPanamaPapua New GuineaParaguayPeruPhilippinesPolandPortugalPost-demographic dividendPre-demographic dividendPuerto RicoQatarRomaniaRussian FederationRwandaSamoaSao Tome and PrincipeSaudi ArabiaSenegalSerbiaSeychellesSierra LeoneSingaporeSlovak RepublicSloveniaSmall statesSolomon IslandsSomaliaSouth AfricaSouth AsiaSouth Asia (IDA & IBRD)South SudanSpainSri LankaSt. LuciaSt. Vincent and the GrenadinesSub-Saharan Africa Sub-Saharan Africa (excluding high income)Sub-Saharan Africa (IDA & IBRD countries)SudanSurinameSwazilandSwedenSwitzerlandSyrian Arab RepublicTajikistanTanzaniaThailandTimor-LesteTogoTongaTrinidad and TobagoTunisiaTurkeyTurkmenistanUgandaUkraineUnited Arab EmiratesUnited KingdomUnited StatesUpper middle incomeUruguayUzbekistanVanuatuVenezuela, RBVietnamVirgin Islands (U.S.)West Bank and GazaWorldYemen, Rep.ZambiaZimbabwe Timeline:
This timeline shows a graph from 1961 to 2015 of IDA & IBRD total. No data until 1960. Number of actual observations by date: 55.
Source name:
World Development Indicators
Source organization:
United Nations Population Division. World Population Prospects. New York, United Nations, Department of Economic and Social Affairs (advanced Excel tables). Available at http://esa.un.org/wpp/unpp/panel_population.htm.
Categories, topics:
Health, Gender
Last updated:
apr 23, 2017
Indicators value changes by year
Minimum:
43.366
jan 1, 1961
Maximum:
77.834
jan 1, 2015
At the date of observation
Value
Absolute change
Change from previous value
jan 1, 1961
43.366
+43.366
0.0%
jan 1, 1962
44.004
+0.638
1.47%
jan 1, 1963
44.623
+0.619
1.41%
jan 1, 1964
46.114
+1.491
3.34%
jan 1, 1965
47.601
+1.487
3.23%
jan 1, 1966
49.076
+1.474
3.1%
jan 1, 1967
50.565
+1.49
3.04%
jan 1, 1968
52.053
+1.488
2.94%
jan 1, 1969
53.101
+1.048
2.01%
jan 1, 1970
54.152
+1.051
1.98%
jan 1, 1971
55.203
+1.051
1.94%
jan 1, 1972
56.276
+1.073
1.94%
jan 1, 1973
57.345
+1.069
1.9%
jan 1, 1974
58.221
+0.877
1.53%
jan 1, 1975
59.094
+0.873
1.5%
jan 1, 1976
59.964
+0.87
1.47%
jan 1, 1977
60.85
+0.886
1.48%
jan 1, 1978
61.734
+0.884
1.45%
jan 1, 1979
62.338
+0.605
0.98%
jan 1, 1980
62.948
+0.609
0.98%
jan 1, 1981
63.561
+0.614
0.97%
jan 1, 1982
64.202
+0.64
1.01%
jan 1, 1983
64.845
+0.643
1.0%
jan 1, 1984
65.337
+0.492
0.76%
jan 1, 1985
65.82
+0.483
0.74%
jan 1, 1986
66.295
+0.476
0.72%
jan 1, 1987
66.775
+0.479
0.72%
jan 1, 1988
67.246
+0.472
0.71%
jan 1, 1989
67.587
+0.341
0.51%
jan 1, 1990
67.921
+0.334
0.49%
jan 1, 1991
68.25
+0.329
0.48%
jan 1, 1992
68.575
+0.324
0.48%
jan 1, 1993
68.906
+0.331
0.48%
jan 1, 1994
69.236
+0.33
0.48%
jan 1, 1995
69.561
+0.325
0.47%
jan 1, 1996
69.882
+0.321
0.46%
jan 1, 1997
70.229
+0.347
0.5%
jan 1, 1998
70.569
+0.34
0.48%
jan 1, 1999
70.945
+0.376
0.53%
jan 1, 2000
71.322
+0.377
0.53%
jan 1, 2001
71.7
+0.378
0.53%
jan 1, 2002
72.091
+0.391
0.55%
jan 1, 2003
72.485
+0.394
0.55%
jan 1, 2004
72.985
+0.499
0.69%
jan 1, 2005
73.482
+0.497
0.68%
jan 1, 2006
73.975
+0.493
0.67%
jan 1, 2007
74.466
+0.491
0.66%
jan 1, 2008
74.953
+0.487
0.65%
jan 1, 2009
75.424
+0.47
0.63%
jan 1, 2010
75.888
+0.465
0.62%
jan 1, 2011
76.346
+0.458
0.6%
jan 1, 2012
76.804
+0.458
0.6%
jan 1, 2013
77.258
+0.454
0.59%
jan 1, 2014
77.547
+0.289
0.37%
jan 1, 2015
77.834
+0.287
0.37%
Ranking of countries by current statistics by years


Comments: