29
/
en
AIzaSyAYiBZKx7MnpbEhh9jyipgxe19OcubqV5w
April 1, 2024
183350
Macao SAR, China
MAC
true
2
1
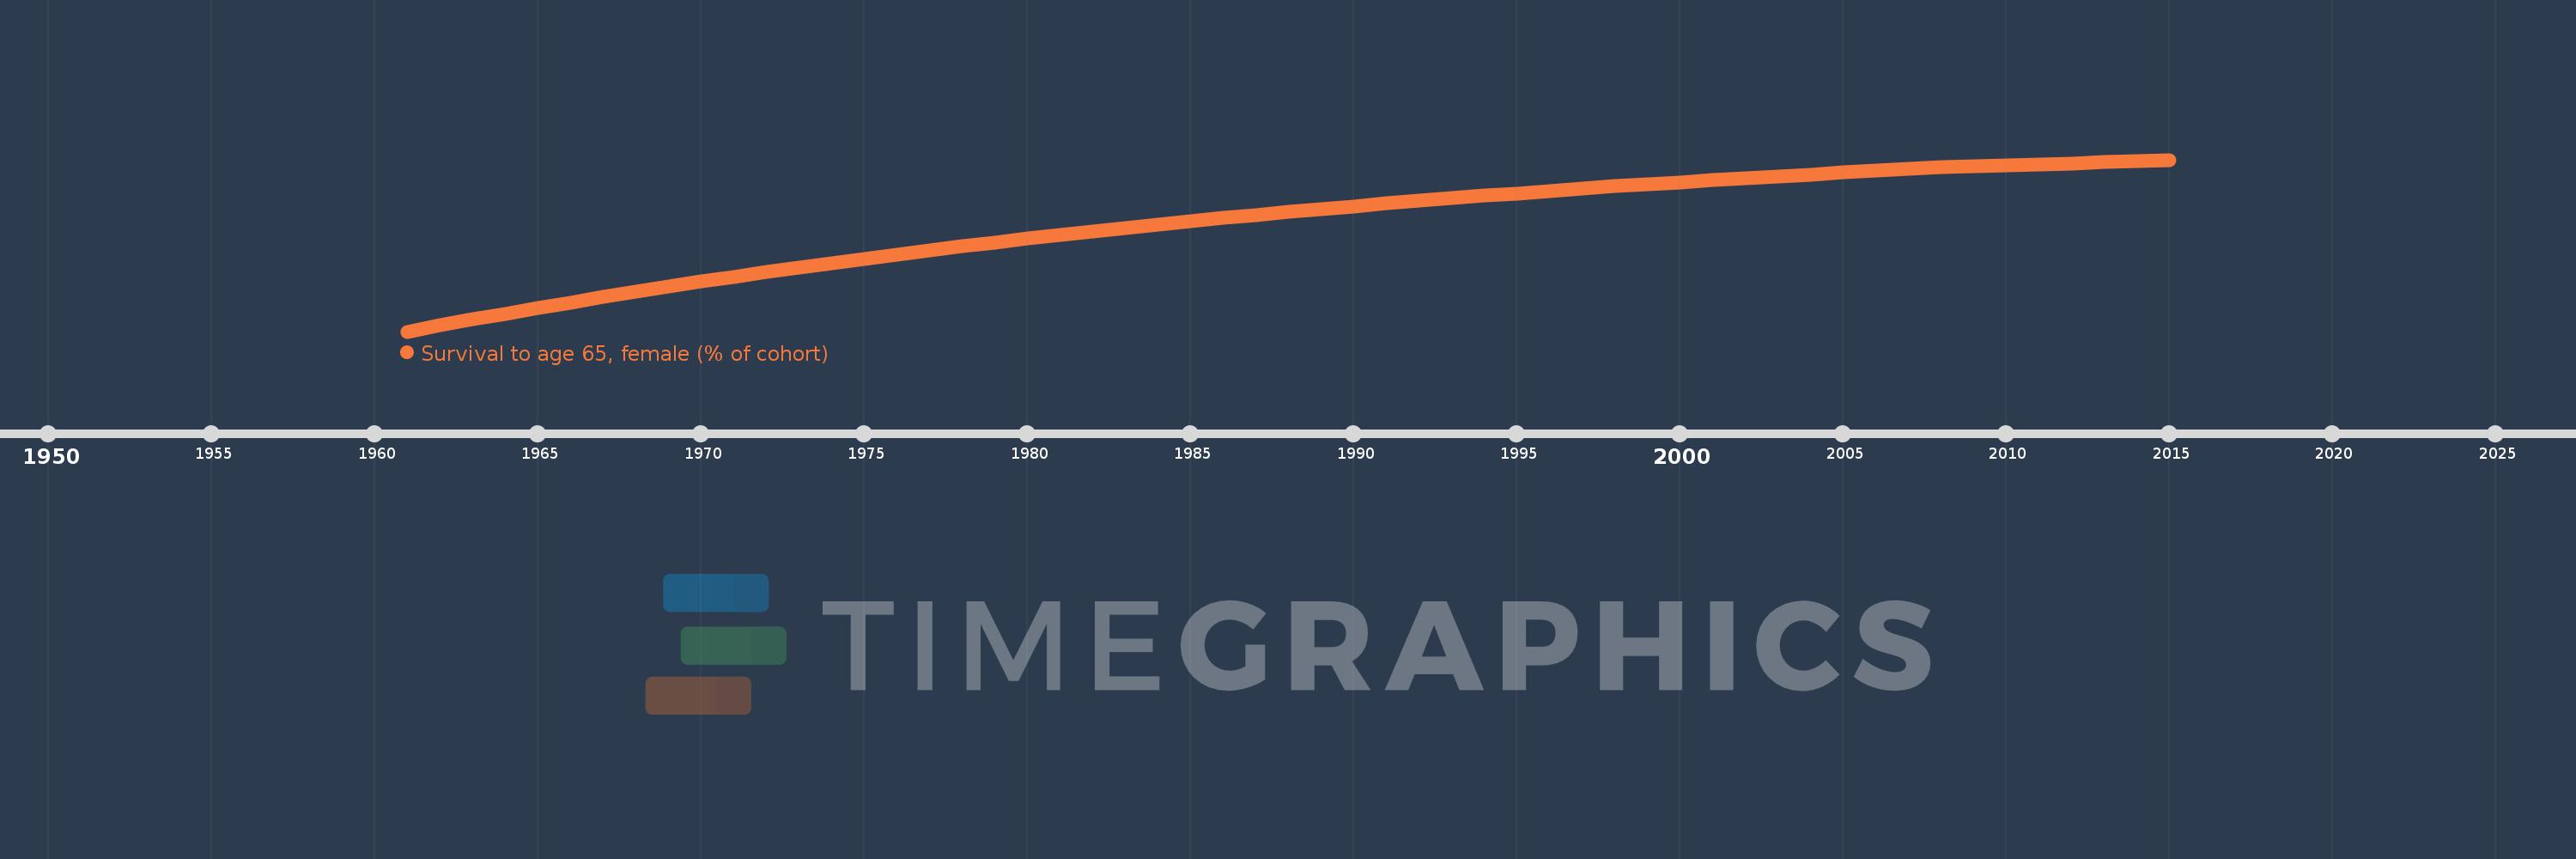
Survival to age 65, female (% of cohort)
2015,2014,2013,2012,2011,2010,2009,2008,2007,2006,2005,2004,2003,2002,2001,2000,1999,1998,1997,1996,1995,1994,1993,1992,1991,1990,1989,1988,1987,1986,1985,1984,1983,1982,1981,1980,1979,1978,1977,1976,1975,1974,1973,1972,1971,1970,1969,1968,1967,1966,1965,1964,1963,1962,1961
This statistics in other country:
AfghanistanAlbaniaAlgeriaAngolaAntigua and BarbudaArab WorldArgentinaArmeniaArubaAustraliaAustriaAzerbaijanBahamas, TheBahrainBangladeshBarbadosBelarusBelgiumBelizeBeninBhutanBoliviaBosnia and HerzegovinaBotswanaBrazilBrunei DarussalamBulgariaBurkina FasoBurundiCabo VerdeCambodiaCameroonCanadaCaribbean small statesCentral African RepublicCentral Europe and the BalticsChadChannel IslandsChileChinaColombiaComorosCongo, Dem. Rep.Congo, Rep.Costa RicaCote d'IvoireCroatiaCubaCuracaoCyprusCzech RepublicDenmarkDjiboutiDominican RepublicEarly-demographic dividendEast Asia & PacificEast Asia & Pacific (excluding high income)East Asia & Pacific (IDA & IBRD countries)EcuadorEgypt, Arab Rep.El SalvadorEquatorial GuineaEritreaEstoniaEthiopiaEuro areaEurope & Central AsiaEurope & Central Asia (excluding high income)Europe & Central Asia (IDA & IBRD countries)European UnionFijiFinlandFragile and conflict affected situationsFranceFrench PolynesiaGabonGambia, TheGeorgiaGermanyGhanaGreeceGrenadaGuamGuatemalaGuineaGuinea-BissauGuyanaHaitiHeavily indebted poor countries (HIPC)High incomeHondurasHong Kong SAR, ChinaHungaryIBRD onlyIcelandIDA & IBRD totalIDA blendIDA onlyIDA totalIndiaIndonesiaIran, Islamic Rep.IraqIrelandIsraelItalyJamaicaJapanJordanKazakhstanKenyaKiribatiKorea, Dem. People’s Rep.Korea, Rep.KuwaitKyrgyz RepublicLao PDRLate-demographic dividendLatin America & Caribbean Latin America & Caribbean (excluding high income)Latin America & the Caribbean (IDA & IBRD countries)LatviaLeast developed countries: UN classificationLebanonLesothoLiberiaLibyaLithuaniaLow & middle incomeLow incomeLower middle incomeLuxembourgMacao SAR, ChinaMacedonia, FYRMadagascarMalawiMalaysiaMaldivesMaliMaltaMauritaniaMauritiusMexicoMicronesia, Fed. Sts.Middle East & North AfricaMiddle East & North Africa (excluding high income)Middle East & North Africa (IDA & IBRD countries)Middle incomeMoldovaMongoliaMontenegroMoroccoMozambiqueMyanmarNamibiaNepalNetherlandsNew CaledoniaNew ZealandNicaraguaNigerNigeriaNorth AmericaNorwayOECD membersOmanOther small statesPacific island small statesPakistanPanamaPapua New GuineaParaguayPeruPhilippinesPolandPortugalPost-demographic dividendPre-demographic dividendPuerto RicoQatarRomaniaRussian FederationRwandaSamoaSao Tome and PrincipeSaudi ArabiaSenegalSerbiaSeychellesSierra LeoneSingaporeSlovak RepublicSloveniaSmall statesSolomon IslandsSomaliaSouth AfricaSouth AsiaSouth Asia (IDA & IBRD)South SudanSpainSri LankaSt. LuciaSt. Vincent and the GrenadinesSub-Saharan Africa Sub-Saharan Africa (excluding high income)Sub-Saharan Africa (IDA & IBRD countries)SudanSurinameSwazilandSwedenSwitzerlandSyrian Arab RepublicTajikistanTanzaniaThailandTimor-LesteTogoTongaTrinidad and TobagoTunisiaTurkeyTurkmenistanUgandaUkraineUnited Arab EmiratesUnited KingdomUnited StatesUpper middle incomeUruguayUzbekistanVanuatuVenezuela, RBVietnamVirgin Islands (U.S.)West Bank and GazaWorldYemen, Rep.ZambiaZimbabwe Timeline:
This timeline shows a graph from 1961 to 2015 of Macao SAR, China. No data until 1960. Number of actual observations by date: 55.
Source name:
World Development Indicators
Source organization:
United Nations Population Division. World Population Prospects. New York, United Nations, Department of Economic and Social Affairs (advanced Excel tables). Available at http://esa.un.org/wpp/unpp/panel_population.htm.
Categories, topics:
Health, Gender
Last updated:
apr 23, 2017
Indicators value changes by year
Minimum:
69.361
jan 1, 1961
Maximum:
93.616
jan 1, 2015
At the date of observation
Value
Absolute change
Change from previous value
jan 1, 1961
69.361
+69.361
0.0%
jan 1, 1962
70.243
+0.883
1.27%
jan 1, 1963
71.126
+0.883
1.26%
jan 1, 1964
71.906
+0.78
1.1%
jan 1, 1965
72.687
+0.78
1.09%
jan 1, 1966
73.467
+0.78
1.07%
jan 1, 1967
74.247
+0.78
1.06%
jan 1, 1968
75.028
+0.78
1.05%
jan 1, 1969
75.712
+0.685
0.91%
jan 1, 1970
76.397
+0.685
0.9%
jan 1, 1971
77.081
+0.685
0.9%
jan 1, 1972
77.766
+0.685
0.89%
jan 1, 1973
78.451
+0.685
0.88%
jan 1, 1974
79.048
+0.597
0.76%
jan 1, 1975
79.645
+0.597
0.76%
jan 1, 1976
80.242
+0.597
0.75%
jan 1, 1977
80.839
+0.597
0.74%
jan 1, 1978
81.436
+0.597
0.74%
jan 1, 1979
81.955
+0.518
0.64%
jan 1, 1980
82.473
+0.518
0.63%
jan 1, 1981
82.992
+0.518
0.63%
jan 1, 1982
83.51
+0.519
0.62%
jan 1, 1983
84.029
+0.518
0.62%
jan 1, 1984
84.477
+0.449
0.53%
jan 1, 1985
84.926
+0.449
0.53%
jan 1, 1986
85.375
+0.449
0.53%
jan 1, 1987
85.823
+0.449
0.53%
jan 1, 1988
86.272
+0.449
0.52%
jan 1, 1989
86.659
+0.387
0.45%
jan 1, 1990
87.046
+0.387
0.45%
jan 1, 1991
87.433
+0.387
0.44%
jan 1, 1992
87.82
+0.387
0.44%
jan 1, 1993
88.207
+0.387
0.44%
jan 1, 1994
88.54
+0.333
0.38%
jan 1, 1995
88.873
+0.333
0.38%
jan 1, 1996
89.206
+0.333
0.37%
jan 1, 1997
89.54
+0.333
0.37%
jan 1, 1998
89.873
+0.333
0.37%
jan 1, 1999
90.159
+0.286
0.32%
jan 1, 2000
90.446
+0.286
0.32%
jan 1, 2001
90.732
+0.286
0.32%
jan 1, 2002
91.018
+0.286
0.32%
jan 1, 2003
91.305
+0.286
0.31%
jan 1, 2004
91.551
+0.246
0.27%
jan 1, 2005
91.797
+0.246
0.27%
jan 1, 2006
92.043
+0.246
0.27%
jan 1, 2007
92.289
+0.246
0.27%
jan 1, 2008
92.535
+0.246
0.27%
jan 1, 2009
92.681
+0.146
0.16%
jan 1, 2010
92.828
+0.146
0.16%
jan 1, 2011
92.974
+0.146
0.16%
jan 1, 2012
93.12
+0.146
0.16%
jan 1, 2013
93.267
+0.146
0.16%
jan 1, 2014
93.441
+0.175
0.19%
jan 1, 2015
93.616
+0.175
0.19%
Ranking of countries by current statistics by years


Comments: