29
/
en
AIzaSyAYiBZKx7MnpbEhh9jyipgxe19OcubqV5w
April 1, 2024
120503
Djibouti
DJI
true
2
1
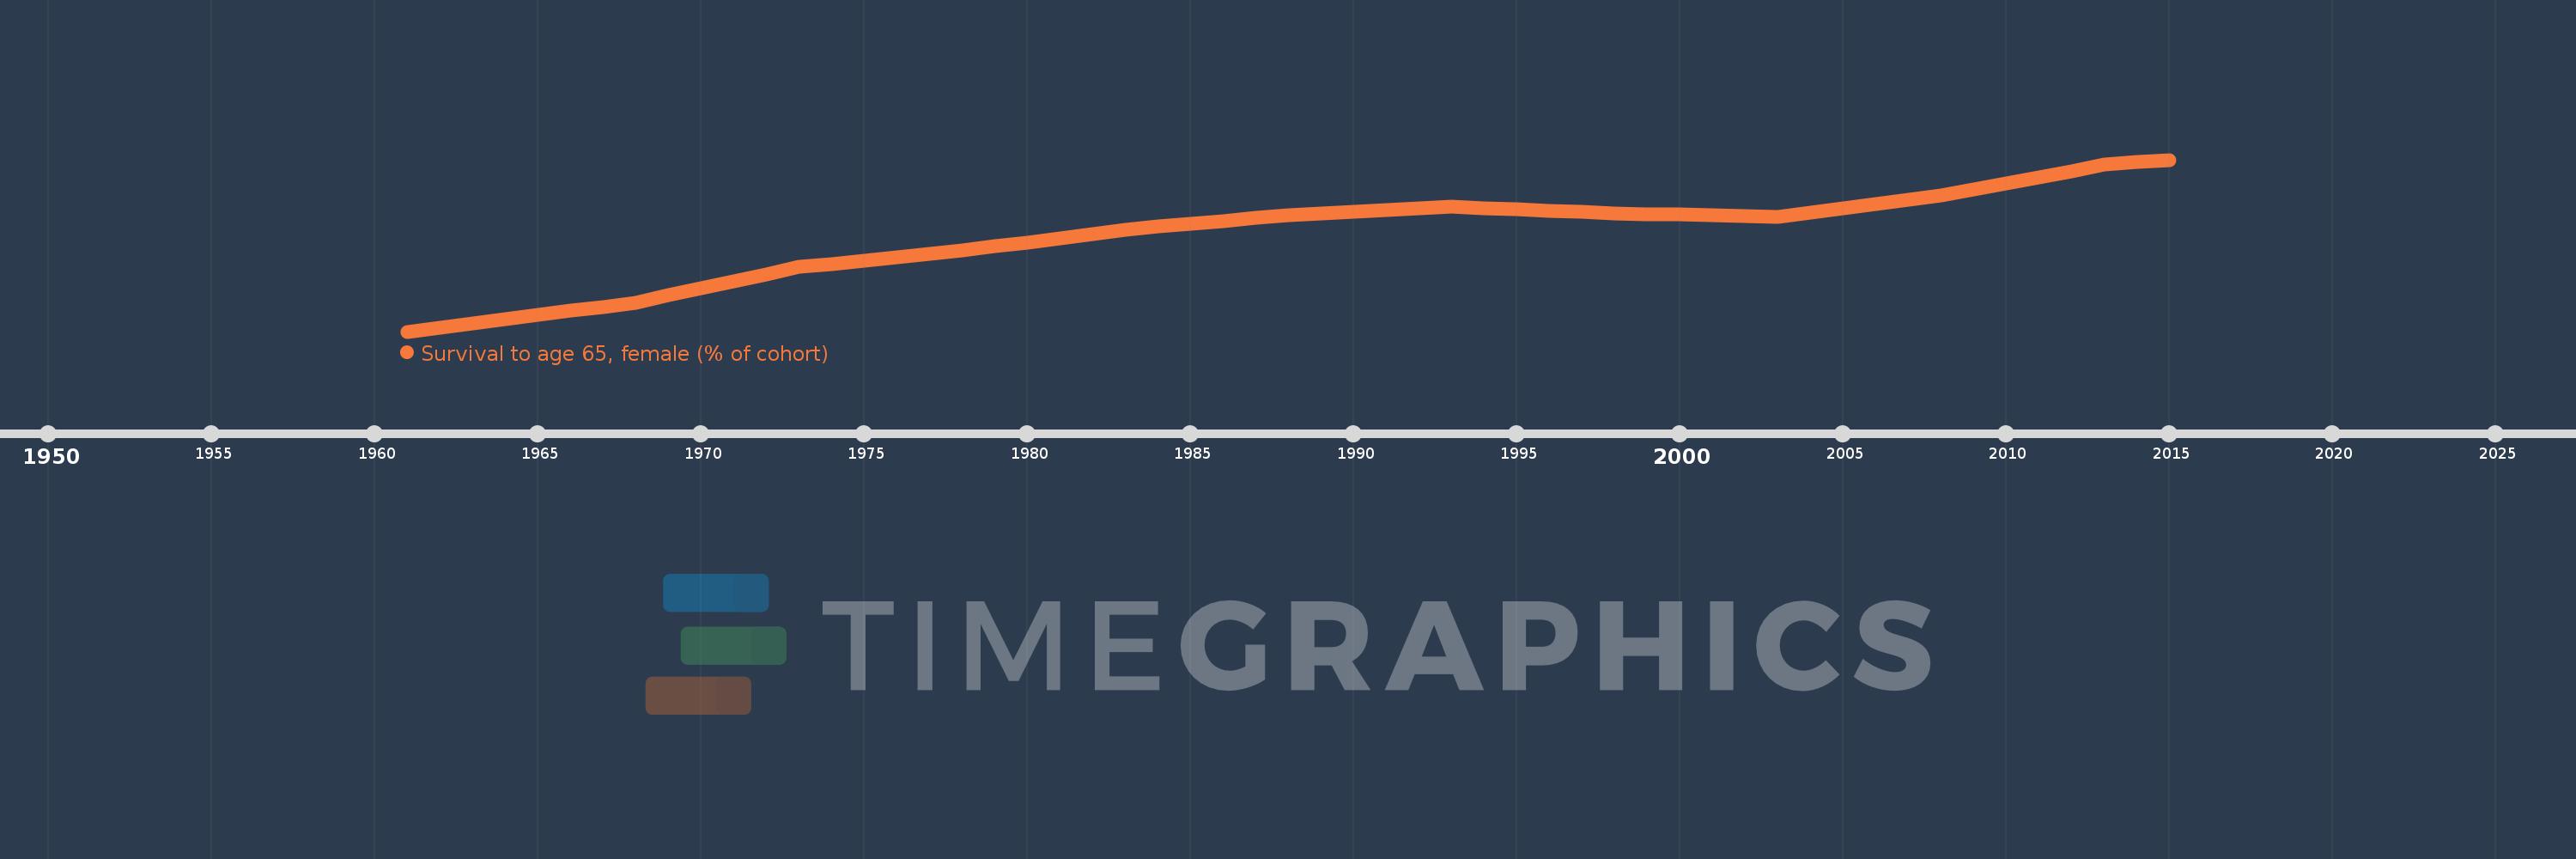
Survival to age 65, female (% of cohort)
2015,2014,2013,2012,2011,2010,2009,2008,2007,2006,2005,2004,2003,2002,2001,2000,1999,1998,1997,1996,1995,1994,1993,1992,1991,1990,1989,1988,1987,1986,1985,1984,1983,1982,1981,1980,1979,1978,1977,1976,1975,1974,1973,1972,1971,1970,1969,1968,1967,1966,1965,1964,1963,1962,1961
This statistics in other country:
AfghanistanAlbaniaAlgeriaAngolaAntigua and BarbudaArab WorldArgentinaArmeniaArubaAustraliaAustriaAzerbaijanBahamas, TheBahrainBangladeshBarbadosBelarusBelgiumBelizeBeninBhutanBoliviaBosnia and HerzegovinaBotswanaBrazilBrunei DarussalamBulgariaBurkina FasoBurundiCabo VerdeCambodiaCameroonCanadaCaribbean small statesCentral African RepublicCentral Europe and the BalticsChadChannel IslandsChileChinaColombiaComorosCongo, Dem. Rep.Congo, Rep.Costa RicaCote d'IvoireCroatiaCubaCuracaoCyprusCzech RepublicDenmarkDjiboutiDominican RepublicEarly-demographic dividendEast Asia & PacificEast Asia & Pacific (excluding high income)East Asia & Pacific (IDA & IBRD countries)EcuadorEgypt, Arab Rep.El SalvadorEquatorial GuineaEritreaEstoniaEthiopiaEuro areaEurope & Central AsiaEurope & Central Asia (excluding high income)Europe & Central Asia (IDA & IBRD countries)European UnionFijiFinlandFragile and conflict affected situationsFranceFrench PolynesiaGabonGambia, TheGeorgiaGermanyGhanaGreeceGrenadaGuamGuatemalaGuineaGuinea-BissauGuyanaHaitiHeavily indebted poor countries (HIPC)High incomeHondurasHong Kong SAR, ChinaHungaryIBRD onlyIcelandIDA & IBRD totalIDA blendIDA onlyIDA totalIndiaIndonesiaIran, Islamic Rep.IraqIrelandIsraelItalyJamaicaJapanJordanKazakhstanKenyaKiribatiKorea, Dem. People’s Rep.Korea, Rep.KuwaitKyrgyz RepublicLao PDRLate-demographic dividendLatin America & Caribbean Latin America & Caribbean (excluding high income)Latin America & the Caribbean (IDA & IBRD countries)LatviaLeast developed countries: UN classificationLebanonLesothoLiberiaLibyaLithuaniaLow & middle incomeLow incomeLower middle incomeLuxembourgMacao SAR, ChinaMacedonia, FYRMadagascarMalawiMalaysiaMaldivesMaliMaltaMauritaniaMauritiusMexicoMicronesia, Fed. Sts.Middle East & North AfricaMiddle East & North Africa (excluding high income)Middle East & North Africa (IDA & IBRD countries)Middle incomeMoldovaMongoliaMontenegroMoroccoMozambiqueMyanmarNamibiaNepalNetherlandsNew CaledoniaNew ZealandNicaraguaNigerNigeriaNorth AmericaNorwayOECD membersOmanOther small statesPacific island small statesPakistanPanamaPapua New GuineaParaguayPeruPhilippinesPolandPortugalPost-demographic dividendPre-demographic dividendPuerto RicoQatarRomaniaRussian FederationRwandaSamoaSao Tome and PrincipeSaudi ArabiaSenegalSerbiaSeychellesSierra LeoneSingaporeSlovak RepublicSloveniaSmall statesSolomon IslandsSomaliaSouth AfricaSouth AsiaSouth Asia (IDA & IBRD)South SudanSpainSri LankaSt. LuciaSt. Vincent and the GrenadinesSub-Saharan Africa Sub-Saharan Africa (excluding high income)Sub-Saharan Africa (IDA & IBRD countries)SudanSurinameSwazilandSwedenSwitzerlandSyrian Arab RepublicTajikistanTanzaniaThailandTimor-LesteTogoTongaTrinidad and TobagoTunisiaTurkeyTurkmenistanUgandaUkraineUnited Arab EmiratesUnited KingdomUnited StatesUpper middle incomeUruguayUzbekistanVanuatuVenezuela, RBVietnamVirgin Islands (U.S.)West Bank and GazaWorldYemen, Rep.ZambiaZimbabwe Timeline:
This timeline shows a graph from 1961 to 2015 of Djibouti. No data until 1960. Number of actual observations by date: 55.
Source name:
World Development Indicators
Source organization:
United Nations Population Division. World Population Prospects. New York, United Nations, Department of Economic and Social Affairs (advanced Excel tables). Available at http://esa.un.org/wpp/unpp/panel_population.htm.
Categories, topics:
Health, Gender
Last updated:
apr 23, 2017
Indicators value changes by year
Minimum:
38.696
jan 1, 1961
Maximum:
63.917
jan 1, 2015
At the date of observation
Value
Absolute change
Change from previous value
jan 1, 1961
38.696
+38.696
0.0%
jan 1, 1962
39.313
+0.617
1.59%
jan 1, 1963
39.93
+0.617
1.57%
jan 1, 1964
40.533
+0.604
1.51%
jan 1, 1965
41.137
+0.604
1.49%
jan 1, 1966
41.74
+0.604
1.47%
jan 1, 1967
42.344
+0.604
1.45%
jan 1, 1968
42.947
+0.604
1.43%
jan 1, 1969
43.993
+1.046
2.44%
jan 1, 1970
45.039
+1.046
2.38%
jan 1, 1971
46.085
+1.046
2.32%
jan 1, 1972
47.131
+1.046
2.27%
jan 1, 1973
48.177
+1.046
2.22%
jan 1, 1974
48.654
+0.477
0.99%
jan 1, 1975
49.131
+0.477
0.98%
jan 1, 1976
49.607
+0.477
0.97%
jan 1, 1977
50.084
+0.477
0.96%
jan 1, 1978
50.561
+0.477
0.95%
jan 1, 1979
51.182
+0.621
1.23%
jan 1, 1980
51.803
+0.621
1.21%
jan 1, 1981
52.424
+0.621
1.2%
jan 1, 1982
53.045
+0.621
1.18%
jan 1, 1983
53.667
+0.621
1.17%
jan 1, 1984
54.089
+0.422
0.79%
jan 1, 1985
54.511
+0.422
0.78%
jan 1, 1986
54.933
+0.422
0.77%
jan 1, 1987
55.355
+0.422
0.77%
jan 1, 1988
55.777
+0.422
0.76%
jan 1, 1989
56.028
+0.251
0.45%
jan 1, 1990
56.279
+0.251
0.45%
jan 1, 1991
56.531
+0.251
0.45%
jan 1, 1992
56.782
+0.251
0.44%
jan 1, 1993
57.033
+0.251
0.44%
jan 1, 1994
56.843
-0.19
-0.33%
jan 1, 1995
56.653
-0.19
-0.33%
jan 1, 1996
56.462
-0.19
-0.34%
jan 1, 1997
56.272
-0.19
-0.34%
jan 1, 1998
56.082
-0.19
-0.34%
jan 1, 1999
55.965
-0.117
-0.21%
jan 1, 2000
55.848
-0.117
-0.21%
jan 1, 2001
55.731
-0.117
-0.21%
jan 1, 2002
55.614
-0.117
-0.21%
jan 1, 2003
55.497
-0.117
-0.21%
jan 1, 2004
56.133
+0.636
1.15%
jan 1, 2005
56.769
+0.636
1.13%
jan 1, 2006
57.406
+0.636
1.12%
jan 1, 2007
58.042
+0.636
1.11%
jan 1, 2008
58.678
+0.636
1.1%
jan 1, 2009
59.575
+0.897
1.53%
jan 1, 2010
60.472
+0.897
1.51%
jan 1, 2011
61.369
+0.897
1.48%
jan 1, 2012
62.266
+0.897
1.46%
jan 1, 2013
63.163
+0.897
1.44%
jan 1, 2014
63.54
+0.377
0.6%
jan 1, 2015
63.917
+0.377
0.59%
Ranking of countries by current statistics by years


Comments: