29
/
en
AIzaSyAYiBZKx7MnpbEhh9jyipgxe19OcubqV5w
April 1, 2024
68433
Angola
AGO
true
2
1
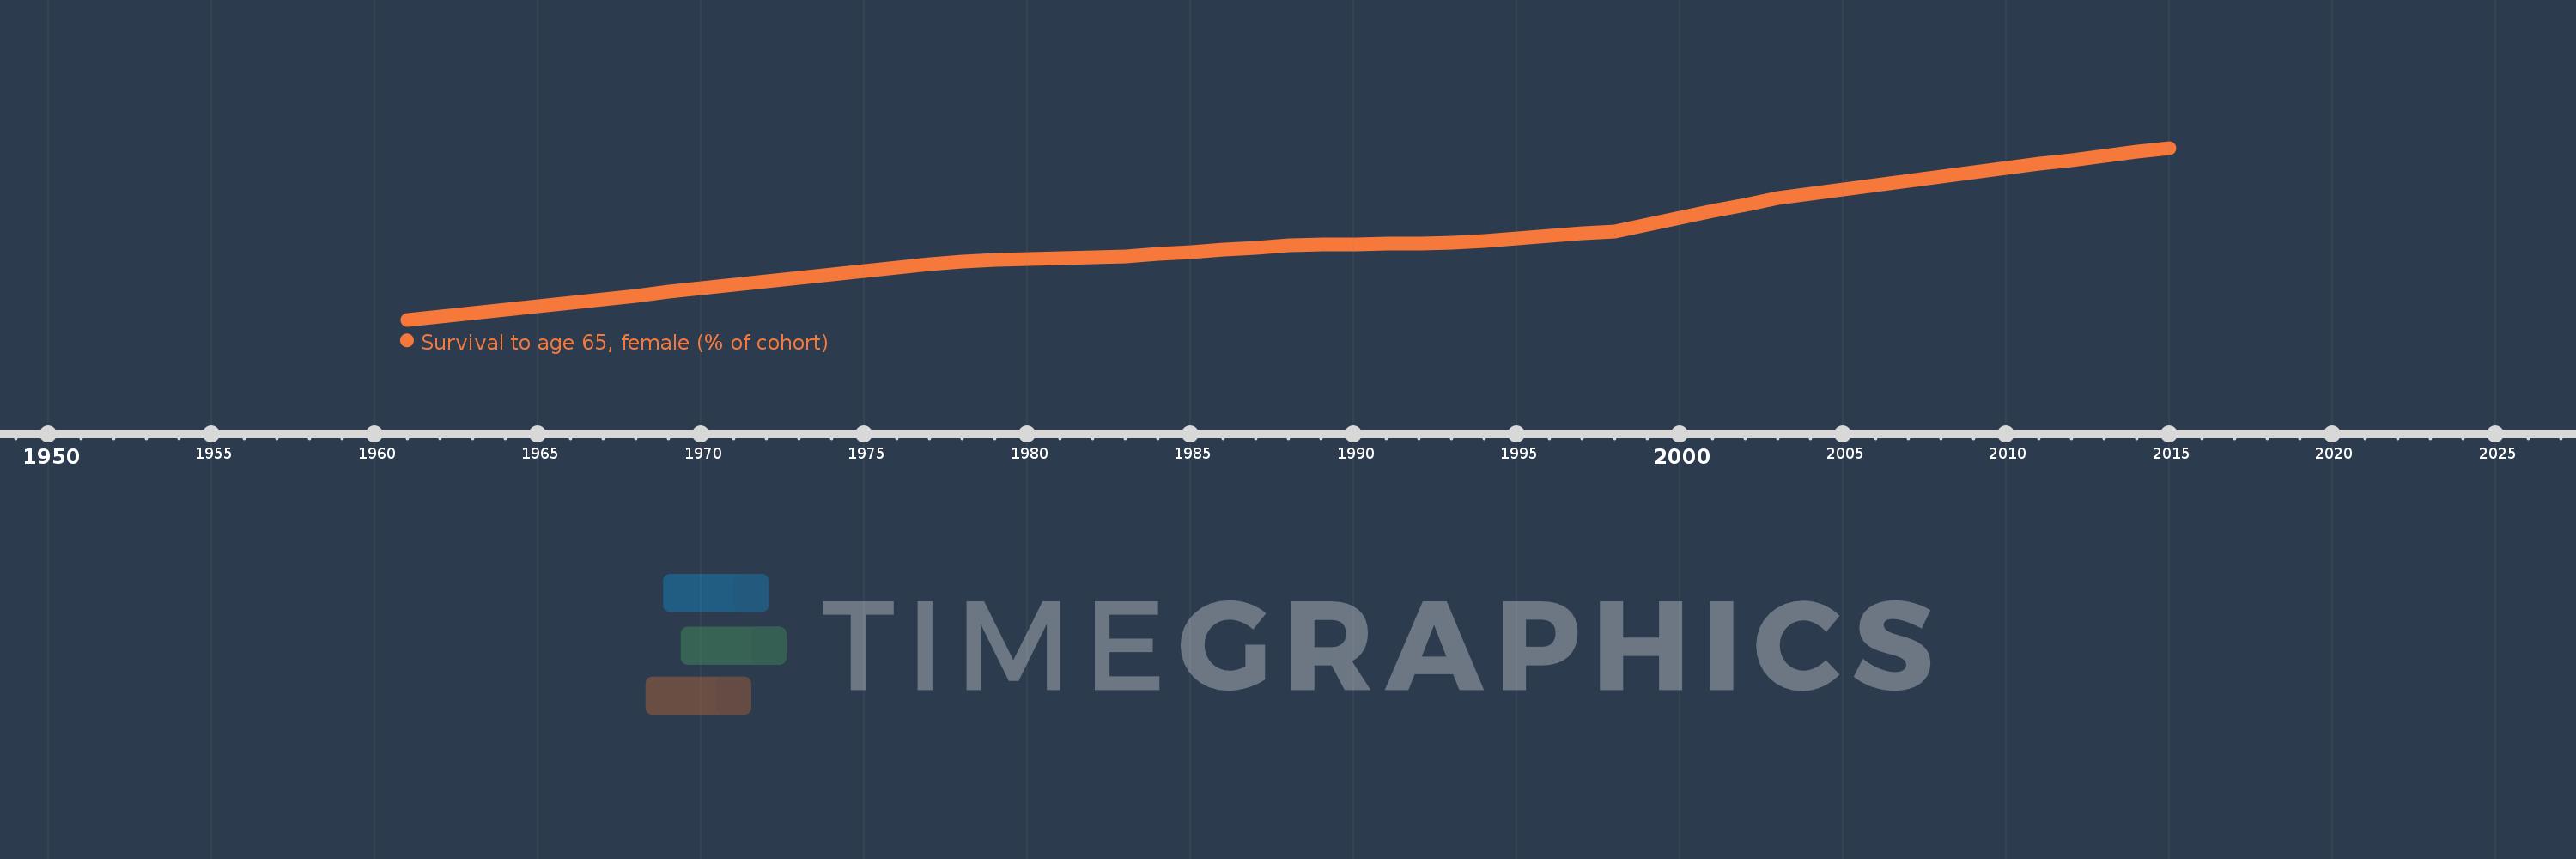
Survival to age 65, female (% of cohort)
2015,2014,2013,2012,2011,2010,2009,2008,2007,2006,2005,2004,2003,2002,2001,2000,1999,1998,1997,1996,1995,1994,1993,1992,1991,1990,1989,1988,1987,1986,1985,1984,1983,1982,1981,1980,1979,1978,1977,1976,1975,1974,1973,1972,1971,1970,1969,1968,1967,1966,1965,1964,1963,1962,1961
This statistics in other country:
AfghanistanAlbaniaAlgeriaAngolaAntigua and BarbudaArab WorldArgentinaArmeniaArubaAustraliaAustriaAzerbaijanBahamas, TheBahrainBangladeshBarbadosBelarusBelgiumBelizeBeninBhutanBoliviaBosnia and HerzegovinaBotswanaBrazilBrunei DarussalamBulgariaBurkina FasoBurundiCabo VerdeCambodiaCameroonCanadaCaribbean small statesCentral African RepublicCentral Europe and the BalticsChadChannel IslandsChileChinaColombiaComorosCongo, Dem. Rep.Congo, Rep.Costa RicaCote d'IvoireCroatiaCubaCuracaoCyprusCzech RepublicDenmarkDjiboutiDominican RepublicEarly-demographic dividendEast Asia & PacificEast Asia & Pacific (excluding high income)East Asia & Pacific (IDA & IBRD countries)EcuadorEgypt, Arab Rep.El SalvadorEquatorial GuineaEritreaEstoniaEthiopiaEuro areaEurope & Central AsiaEurope & Central Asia (excluding high income)Europe & Central Asia (IDA & IBRD countries)European UnionFijiFinlandFragile and conflict affected situationsFranceFrench PolynesiaGabonGambia, TheGeorgiaGermanyGhanaGreeceGrenadaGuamGuatemalaGuineaGuinea-BissauGuyanaHaitiHeavily indebted poor countries (HIPC)High incomeHondurasHong Kong SAR, ChinaHungaryIBRD onlyIcelandIDA & IBRD totalIDA blendIDA onlyIDA totalIndiaIndonesiaIran, Islamic Rep.IraqIrelandIsraelItalyJamaicaJapanJordanKazakhstanKenyaKiribatiKorea, Dem. People’s Rep.Korea, Rep.KuwaitKyrgyz RepublicLao PDRLate-demographic dividendLatin America & Caribbean Latin America & Caribbean (excluding high income)Latin America & the Caribbean (IDA & IBRD countries)LatviaLeast developed countries: UN classificationLebanonLesothoLiberiaLibyaLithuaniaLow & middle incomeLow incomeLower middle incomeLuxembourgMacao SAR, ChinaMacedonia, FYRMadagascarMalawiMalaysiaMaldivesMaliMaltaMauritaniaMauritiusMexicoMicronesia, Fed. Sts.Middle East & North AfricaMiddle East & North Africa (excluding high income)Middle East & North Africa (IDA & IBRD countries)Middle incomeMoldovaMongoliaMontenegroMoroccoMozambiqueMyanmarNamibiaNepalNetherlandsNew CaledoniaNew ZealandNicaraguaNigerNigeriaNorth AmericaNorwayOECD membersOmanOther small statesPacific island small statesPakistanPanamaPapua New GuineaParaguayPeruPhilippinesPolandPortugalPost-demographic dividendPre-demographic dividendPuerto RicoQatarRomaniaRussian FederationRwandaSamoaSao Tome and PrincipeSaudi ArabiaSenegalSerbiaSeychellesSierra LeoneSingaporeSlovak RepublicSloveniaSmall statesSolomon IslandsSomaliaSouth AfricaSouth AsiaSouth Asia (IDA & IBRD)South SudanSpainSri LankaSt. LuciaSt. Vincent and the GrenadinesSub-Saharan Africa Sub-Saharan Africa (excluding high income)Sub-Saharan Africa (IDA & IBRD countries)SudanSurinameSwazilandSwedenSwitzerlandSyrian Arab RepublicTajikistanTanzaniaThailandTimor-LesteTogoTongaTrinidad and TobagoTunisiaTurkeyTurkmenistanUgandaUkraineUnited Arab EmiratesUnited KingdomUnited StatesUpper middle incomeUruguayUzbekistanVanuatuVenezuela, RBVietnamVirgin Islands (U.S.)West Bank and GazaWorldYemen, Rep.ZambiaZimbabwe Timeline:
This timeline shows a graph from 1961 to 2015 of Angola. No data until 1960. Number of actual observations by date: 55.
Source name:
World Development Indicators
Source organization:
United Nations Population Division. World Population Prospects. New York, United Nations, Department of Economic and Social Affairs (advanced Excel tables). Available at http://esa.un.org/wpp/unpp/panel_population.htm.
Categories, topics:
Health, Gender
Last updated:
apr 23, 2017
Indicators value changes by year
Minimum:
24.267
jan 1, 1961
Maximum:
49.667
jan 1, 2015
At the date of observation
Value
Absolute change
Change from previous value
jan 1, 1961
24.267
+24.267
0.0%
jan 1, 1962
24.767
+0.499
2.06%
jan 1, 1963
25.266
+0.499
2.02%
jan 1, 1964
25.78
+0.514
2.04%
jan 1, 1965
26.294
+0.514
1.99%
jan 1, 1966
26.808
+0.514
1.96%
jan 1, 1967
27.323
+0.514
1.92%
jan 1, 1968
27.837
+0.514
1.88%
jan 1, 1969
28.364
+0.528
1.9%
jan 1, 1970
28.892
+0.527
1.86%
jan 1, 1971
29.419
+0.528
1.83%
jan 1, 1972
29.947
+0.528
1.79%
jan 1, 1973
30.474
+0.528
1.76%
jan 1, 1974
30.962
+0.487
1.6%
jan 1, 1975
31.449
+0.487
1.57%
jan 1, 1976
31.937
+0.487
1.55%
jan 1, 1977
32.424
+0.487
1.53%
jan 1, 1978
32.912
+0.487
1.5%
jan 1, 1979
33.058
+0.147
0.45%
jan 1, 1980
33.205
+0.147
0.44%
jan 1, 1981
33.351
+0.147
0.44%
jan 1, 1982
33.498
+0.147
0.44%
jan 1, 1983
33.645
+0.147
0.44%
jan 1, 1984
33.973
+0.328
0.98%
jan 1, 1985
34.301
+0.328
0.97%
jan 1, 1986
34.629
+0.328
0.96%
jan 1, 1987
34.957
+0.328
0.95%
jan 1, 1988
35.286
+0.328
0.94%
jan 1, 1989
35.353
+0.068
0.19%
jan 1, 1990
35.421
+0.068
0.19%
jan 1, 1991
35.489
+0.068
0.19%
jan 1, 1992
35.556
+0.068
0.19%
jan 1, 1993
35.624
+0.068
0.19%
jan 1, 1994
35.97
+0.346
0.97%
jan 1, 1995
36.315
+0.346
0.96%
jan 1, 1996
36.661
+0.346
0.95%
jan 1, 1997
37.007
+0.346
0.94%
jan 1, 1998
37.353
+0.346
0.93%
jan 1, 1999
38.341
+0.988
2.65%
jan 1, 2000
39.33
+0.988
2.58%
jan 1, 2001
40.318
+0.988
2.51%
jan 1, 2002
41.307
+0.988
2.45%
jan 1, 2003
42.295
+0.988
2.39%
jan 1, 2004
42.928
+0.633
1.5%
jan 1, 2005
43.561
+0.633
1.47%
jan 1, 2006
44.194
+0.633
1.45%
jan 1, 2007
44.827
+0.633
1.43%
jan 1, 2008
45.46
+0.633
1.41%
jan 1, 2009
46.071
+0.611
1.34%
jan 1, 2010
46.682
+0.611
1.33%
jan 1, 2011
47.293
+0.611
1.31%
jan 1, 2012
47.904
+0.611
1.29%
jan 1, 2013
48.515
+0.611
1.28%
jan 1, 2014
49.091
+0.576
1.19%
jan 1, 2015
49.667
+0.576
1.17%
Ranking of countries by current statistics by years


Comments: