29
/
en
AIzaSyAYiBZKx7MnpbEhh9jyipgxe19OcubqV5w
April 1, 2024
41103
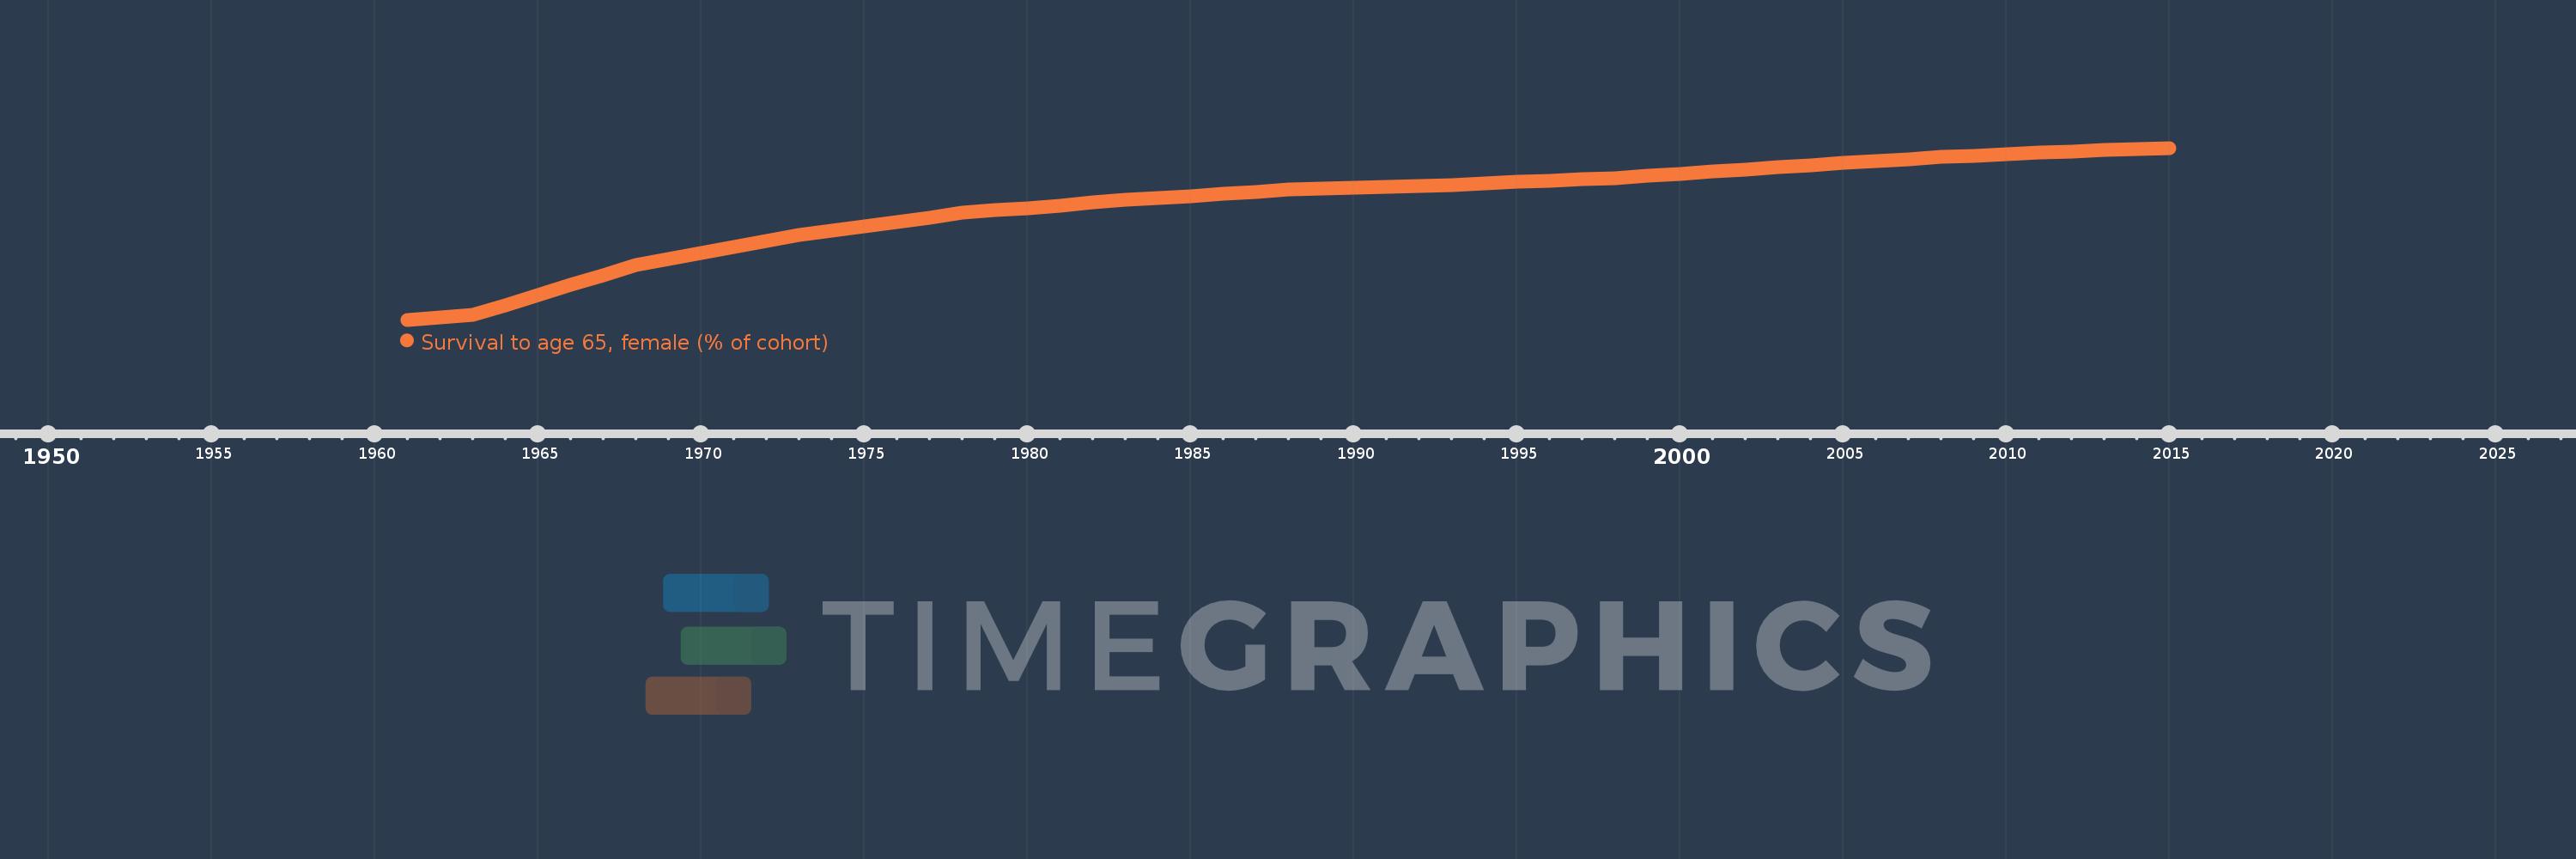
Late-demographic dividend
LTE
false
2
1
Survival to age 65, female (% of cohort)
2015,2014,2013,2012,2011,2010,2009,2008,2007,2006,2005,2004,2003,2002,2001,2000,1999,1998,1997,1996,1995,1994,1993,1992,1991,1990,1989,1988,1987,1986,1985,1984,1983,1982,1981,1980,1979,1978,1977,1976,1975,1974,1973,1972,1971,1970,1969,1968,1967,1966,1965,1964,1963,1962,1961
This statistics in other country:
AfghanistanAlbaniaAlgeriaAngolaAntigua and BarbudaArab WorldArgentinaArmeniaArubaAustraliaAustriaAzerbaijanBahamas, TheBahrainBangladeshBarbadosBelarusBelgiumBelizeBeninBhutanBoliviaBosnia and HerzegovinaBotswanaBrazilBrunei DarussalamBulgariaBurkina FasoBurundiCabo VerdeCambodiaCameroonCanadaCaribbean small statesCentral African RepublicCentral Europe and the BalticsChadChannel IslandsChileChinaColombiaComorosCongo, Dem. Rep.Congo, Rep.Costa RicaCote d'IvoireCroatiaCubaCuracaoCyprusCzech RepublicDenmarkDjiboutiDominican RepublicEarly-demographic dividendEast Asia & PacificEast Asia & Pacific (excluding high income)East Asia & Pacific (IDA & IBRD countries)EcuadorEgypt, Arab Rep.El SalvadorEquatorial GuineaEritreaEstoniaEthiopiaEuro areaEurope & Central AsiaEurope & Central Asia (excluding high income)Europe & Central Asia (IDA & IBRD countries)European UnionFijiFinlandFragile and conflict affected situationsFranceFrench PolynesiaGabonGambia, TheGeorgiaGermanyGhanaGreeceGrenadaGuamGuatemalaGuineaGuinea-BissauGuyanaHaitiHeavily indebted poor countries (HIPC)High incomeHondurasHong Kong SAR, ChinaHungaryIBRD onlyIcelandIDA & IBRD totalIDA blendIDA onlyIDA totalIndiaIndonesiaIran, Islamic Rep.IraqIrelandIsraelItalyJamaicaJapanJordanKazakhstanKenyaKiribatiKorea, Dem. People’s Rep.Korea, Rep.KuwaitKyrgyz RepublicLao PDRLate-demographic dividendLatin America & Caribbean Latin America & Caribbean (excluding high income)Latin America & the Caribbean (IDA & IBRD countries)LatviaLeast developed countries: UN classificationLebanonLesothoLiberiaLibyaLithuaniaLow & middle incomeLow incomeLower middle incomeLuxembourgMacao SAR, ChinaMacedonia, FYRMadagascarMalawiMalaysiaMaldivesMaliMaltaMauritaniaMauritiusMexicoMicronesia, Fed. Sts.Middle East & North AfricaMiddle East & North Africa (excluding high income)Middle East & North Africa (IDA & IBRD countries)Middle incomeMoldovaMongoliaMontenegroMoroccoMozambiqueMyanmarNamibiaNepalNetherlandsNew CaledoniaNew ZealandNicaraguaNigerNigeriaNorth AmericaNorwayOECD membersOmanOther small statesPacific island small statesPakistanPanamaPapua New GuineaParaguayPeruPhilippinesPolandPortugalPost-demographic dividendPre-demographic dividendPuerto RicoQatarRomaniaRussian FederationRwandaSamoaSao Tome and PrincipeSaudi ArabiaSenegalSerbiaSeychellesSierra LeoneSingaporeSlovak RepublicSloveniaSmall statesSolomon IslandsSomaliaSouth AfricaSouth AsiaSouth Asia (IDA & IBRD)South SudanSpainSri LankaSt. LuciaSt. Vincent and the GrenadinesSub-Saharan Africa Sub-Saharan Africa (excluding high income)Sub-Saharan Africa (IDA & IBRD countries)SudanSurinameSwazilandSwedenSwitzerlandSyrian Arab RepublicTajikistanTanzaniaThailandTimor-LesteTogoTongaTrinidad and TobagoTunisiaTurkeyTurkmenistanUgandaUkraineUnited Arab EmiratesUnited KingdomUnited StatesUpper middle incomeUruguayUzbekistanVanuatuVenezuela, RBVietnamVirgin Islands (U.S.)West Bank and GazaWorldYemen, Rep.ZambiaZimbabwe Timeline:
This timeline shows a graph from 1961 to 2015 of Late-demographic dividend. No data until 1960. Number of actual observations by date: 55.
Source name:
World Development Indicators
Source organization:
United Nations Population Division. World Population Prospects. New York, United Nations, Department of Economic and Social Affairs (advanced Excel tables). Available at http://esa.un.org/wpp/unpp/panel_population.htm.
Categories, topics:
Health, Gender
Last updated:
apr 23, 2017
Indicators value changes by year
Minimum:
48.181
jan 1, 1961
Maximum:
86.115
jan 1, 2015
At the date of observation
Value
Absolute change
Change from previous value
jan 1, 1961
48.181
+48.181
0.0%
jan 1, 1962
48.736
+0.555
1.15%
jan 1, 1963
49.21
+0.473
0.97%
jan 1, 1964
51.435
+2.226
4.52%
jan 1, 1965
53.661
+2.226
4.33%
jan 1, 1966
55.86
+2.198
4.1%
jan 1, 1967
58.073
+2.213
3.96%
jan 1, 1968
60.286
+2.213
3.81%
jan 1, 1969
61.597
+1.311
2.17%
jan 1, 1970
62.918
+1.321
2.14%
jan 1, 1971
64.253
+1.335
2.12%
jan 1, 1972
65.614
+1.361
2.12%
jan 1, 1973
66.987
+1.373
2.09%
jan 1, 1974
67.933
+0.946
1.41%
jan 1, 1975
68.883
+0.949
1.4%
jan 1, 1976
69.836
+0.953
1.38%
jan 1, 1977
70.789
+0.953
1.36%
jan 1, 1978
71.747
+0.959
1.35%
jan 1, 1979
72.309
+0.561
0.78%
jan 1, 1980
72.874
+0.565
0.78%
jan 1, 1981
73.445
+0.571
0.78%
jan 1, 1982
74.023
+0.578
0.79%
jan 1, 1983
74.606
+0.583
0.79%
jan 1, 1984
75.059
+0.453
0.61%
jan 1, 1985
75.515
+0.456
0.61%
jan 1, 1986
75.974
+0.458
0.61%
jan 1, 1987
76.435
+0.461
0.61%
jan 1, 1988
76.898
+0.463
0.61%
jan 1, 1989
77.111
+0.213
0.28%
jan 1, 1990
77.329
+0.218
0.28%
jan 1, 1991
77.549
+0.221
0.29%
jan 1, 1992
77.773
+0.224
0.29%
jan 1, 1993
77.996
+0.222
0.29%
jan 1, 1994
78.281
+0.285
0.37%
jan 1, 1995
78.569
+0.288
0.37%
jan 1, 1996
78.862
+0.293
0.37%
jan 1, 1997
79.153
+0.291
0.37%
jan 1, 1998
79.447
+0.293
0.37%
jan 1, 1999
79.923
+0.477
0.6%
jan 1, 2000
80.401
+0.478
0.6%
jan 1, 2001
80.88
+0.478
0.6%
jan 1, 2002
81.364
+0.484
0.6%
jan 1, 2003
81.85
+0.486
0.6%
jan 1, 2004
82.305
+0.454
0.56%
jan 1, 2005
82.758
+0.453
0.55%
jan 1, 2006
83.21
+0.452
0.55%
jan 1, 2007
83.659
+0.45
0.54%
jan 1, 2008
84.107
+0.448
0.54%
jan 1, 2009
84.416
+0.309
0.37%
jan 1, 2010
84.723
+0.307
0.36%
jan 1, 2011
85.03
+0.307
0.36%
jan 1, 2012
85.336
+0.307
0.36%
jan 1, 2013
85.642
+0.306
0.36%
jan 1, 2014
85.879
+0.237
0.28%
jan 1, 2015
86.115
+0.236
0.28%
Ranking of countries by current statistics by years


Comments: