29
/
en
AIzaSyAYiBZKx7MnpbEhh9jyipgxe19OcubqV5w
April 1, 2024
60407
Sub-Saharan Africa (excluding high income)
SSA
false
2
1
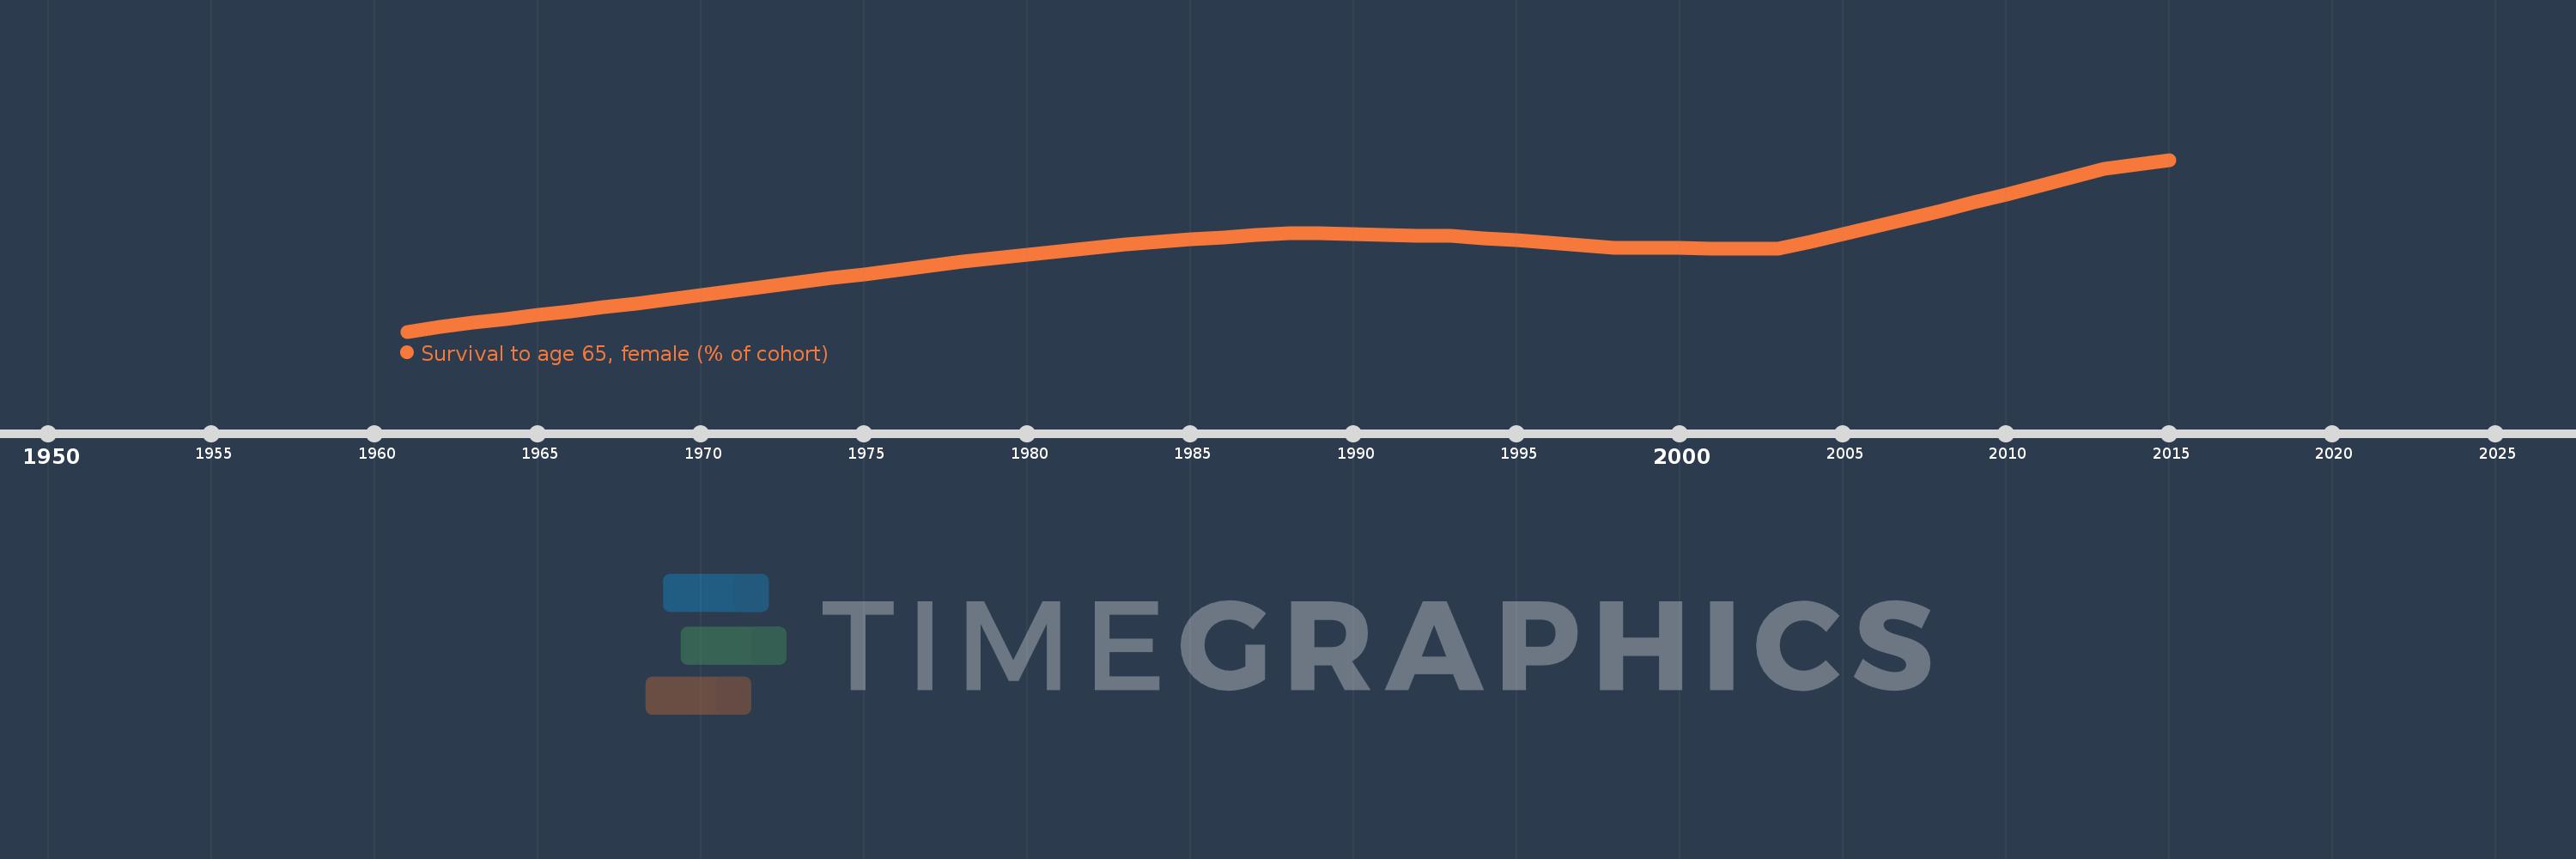
Survival to age 65, female (% of cohort)
2015,2014,2013,2012,2011,2010,2009,2008,2007,2006,2005,2004,2003,2002,2001,2000,1999,1998,1997,1996,1995,1994,1993,1992,1991,1990,1989,1988,1987,1986,1985,1984,1983,1982,1981,1980,1979,1978,1977,1976,1975,1974,1973,1972,1971,1970,1969,1968,1967,1966,1965,1964,1963,1962,1961
This statistics in other country:
AfghanistanAlbaniaAlgeriaAngolaAntigua and BarbudaArab WorldArgentinaArmeniaArubaAustraliaAustriaAzerbaijanBahamas, TheBahrainBangladeshBarbadosBelarusBelgiumBelizeBeninBhutanBoliviaBosnia and HerzegovinaBotswanaBrazilBrunei DarussalamBulgariaBurkina FasoBurundiCabo VerdeCambodiaCameroonCanadaCaribbean small statesCentral African RepublicCentral Europe and the BalticsChadChannel IslandsChileChinaColombiaComorosCongo, Dem. Rep.Congo, Rep.Costa RicaCote d'IvoireCroatiaCubaCuracaoCyprusCzech RepublicDenmarkDjiboutiDominican RepublicEarly-demographic dividendEast Asia & PacificEast Asia & Pacific (excluding high income)East Asia & Pacific (IDA & IBRD countries)EcuadorEgypt, Arab Rep.El SalvadorEquatorial GuineaEritreaEstoniaEthiopiaEuro areaEurope & Central AsiaEurope & Central Asia (excluding high income)Europe & Central Asia (IDA & IBRD countries)European UnionFijiFinlandFragile and conflict affected situationsFranceFrench PolynesiaGabonGambia, TheGeorgiaGermanyGhanaGreeceGrenadaGuamGuatemalaGuineaGuinea-BissauGuyanaHaitiHeavily indebted poor countries (HIPC)High incomeHondurasHong Kong SAR, ChinaHungaryIBRD onlyIcelandIDA & IBRD totalIDA blendIDA onlyIDA totalIndiaIndonesiaIran, Islamic Rep.IraqIrelandIsraelItalyJamaicaJapanJordanKazakhstanKenyaKiribatiKorea, Dem. People’s Rep.Korea, Rep.KuwaitKyrgyz RepublicLao PDRLate-demographic dividendLatin America & Caribbean Latin America & Caribbean (excluding high income)Latin America & the Caribbean (IDA & IBRD countries)LatviaLeast developed countries: UN classificationLebanonLesothoLiberiaLibyaLithuaniaLow & middle incomeLow incomeLower middle incomeLuxembourgMacao SAR, ChinaMacedonia, FYRMadagascarMalawiMalaysiaMaldivesMaliMaltaMauritaniaMauritiusMexicoMicronesia, Fed. Sts.Middle East & North AfricaMiddle East & North Africa (excluding high income)Middle East & North Africa (IDA & IBRD countries)Middle incomeMoldovaMongoliaMontenegroMoroccoMozambiqueMyanmarNamibiaNepalNetherlandsNew CaledoniaNew ZealandNicaraguaNigerNigeriaNorth AmericaNorwayOECD membersOmanOther small statesPacific island small statesPakistanPanamaPapua New GuineaParaguayPeruPhilippinesPolandPortugalPost-demographic dividendPre-demographic dividendPuerto RicoQatarRomaniaRussian FederationRwandaSamoaSao Tome and PrincipeSaudi ArabiaSenegalSerbiaSeychellesSierra LeoneSingaporeSlovak RepublicSloveniaSmall statesSolomon IslandsSomaliaSouth AfricaSouth AsiaSouth Asia (IDA & IBRD)South SudanSpainSri LankaSt. LuciaSt. Vincent and the GrenadinesSub-Saharan Africa Sub-Saharan Africa (excluding high income)Sub-Saharan Africa (IDA & IBRD countries)SudanSurinameSwazilandSwedenSwitzerlandSyrian Arab RepublicTajikistanTanzaniaThailandTimor-LesteTogoTongaTrinidad and TobagoTunisiaTurkeyTurkmenistanUgandaUkraineUnited Arab EmiratesUnited KingdomUnited StatesUpper middle incomeUruguayUzbekistanVanuatuVenezuela, RBVietnamVirgin Islands (U.S.)West Bank and GazaWorldYemen, Rep.ZambiaZimbabwe Timeline:
This timeline shows a graph from 1961 to 2015 of Sub-Saharan Africa (excluding high income). No data until 1960. Number of actual observations by date: 55.
Source name:
World Development Indicators
Source organization:
United Nations Population Division. World Population Prospects. New York, United Nations, Department of Economic and Social Affairs (advanced Excel tables). Available at http://esa.un.org/wpp/unpp/panel_population.htm.
Categories, topics:
Health, Gender
Last updated:
apr 23, 2017
Indicators value changes by year
Minimum:
32.885
jan 1, 1961
Maximum:
57.596
jan 1, 2015
At the date of observation
Value
Absolute change
Change from previous value
jan 1, 1961
32.885
+32.885
0.0%
jan 1, 1962
33.51
+0.625
1.9%
jan 1, 1963
34.133
+0.622
1.86%
jan 1, 1964
34.69
+0.557
1.63%
jan 1, 1965
35.245
+0.555
1.6%
jan 1, 1966
35.799
+0.554
1.57%
jan 1, 1967
36.361
+0.562
1.57%
jan 1, 1968
36.922
+0.56
1.54%
jan 1, 1969
37.528
+0.607
1.64%
jan 1, 1970
38.134
+0.605
1.61%
jan 1, 1971
38.738
+0.605
1.59%
jan 1, 1972
39.351
+0.613
1.58%
jan 1, 1973
39.963
+0.612
1.55%
jan 1, 1974
40.562
+0.599
1.5%
jan 1, 1975
41.159
+0.597
1.47%
jan 1, 1976
41.753
+0.594
1.44%
jan 1, 1977
42.349
+0.596
1.43%
jan 1, 1978
42.941
+0.592
1.4%
jan 1, 1979
43.437
+0.496
1.15%
jan 1, 1980
43.934
+0.497
1.15%
jan 1, 1981
44.434
+0.5
1.14%
jan 1, 1982
44.949
+0.516
1.16%
jan 1, 1983
45.465
+0.515
1.15%
jan 1, 1984
45.787
+0.323
0.71%
jan 1, 1985
46.109
+0.322
0.7%
jan 1, 1986
46.43
+0.321
0.7%
jan 1, 1987
46.756
+0.326
0.7%
jan 1, 1988
47.077
+0.321
0.69%
jan 1, 1989
46.984
-0.094
-0.2%
jan 1, 1990
46.883
-0.101
-0.21%
jan 1, 1991
46.779
-0.103
-0.22%
jan 1, 1992
46.703
-0.077
-0.16%
jan 1, 1993
46.64
-0.063
-0.13%
jan 1, 1994
46.337
-0.303
-0.65%
jan 1, 1995
46.014
-0.323
-0.7%
jan 1, 1996
45.673
-0.341
-0.74%
jan 1, 1997
45.325
-0.348
-0.76%
jan 1, 1998
44.973
-0.352
-0.78%
jan 1, 1999
44.925
-0.047
-0.11%
jan 1, 2000
44.877
-0.048
-0.11%
jan 1, 2001
44.83
-0.047
-0.1%
jan 1, 2002
44.792
-0.039
-0.09%
jan 1, 2003
44.762
-0.029
-0.07%
jan 1, 2004
45.849
+1.087
2.43%
jan 1, 2005
46.938
+1.088
2.37%
jan 1, 2006
48.027
+1.09
2.32%
jan 1, 2007
49.118
+1.091
2.27%
jan 1, 2008
50.212
+1.094
2.23%
jan 1, 2009
51.424
+1.212
2.41%
jan 1, 2010
52.633
+1.208
2.35%
jan 1, 2011
53.837
+1.204
2.29%
jan 1, 2012
55.039
+1.203
2.23%
jan 1, 2013
56.238
+1.199
2.18%
jan 1, 2014
56.916
+0.678
1.21%
jan 1, 2015
57.596
+0.68
1.19%
Ranking of countries by current statistics by years


Comments: