29
/
en
AIzaSyAYiBZKx7MnpbEhh9jyipgxe19OcubqV5w
April 1, 2024
214832
Norway
NOR
true
2
1
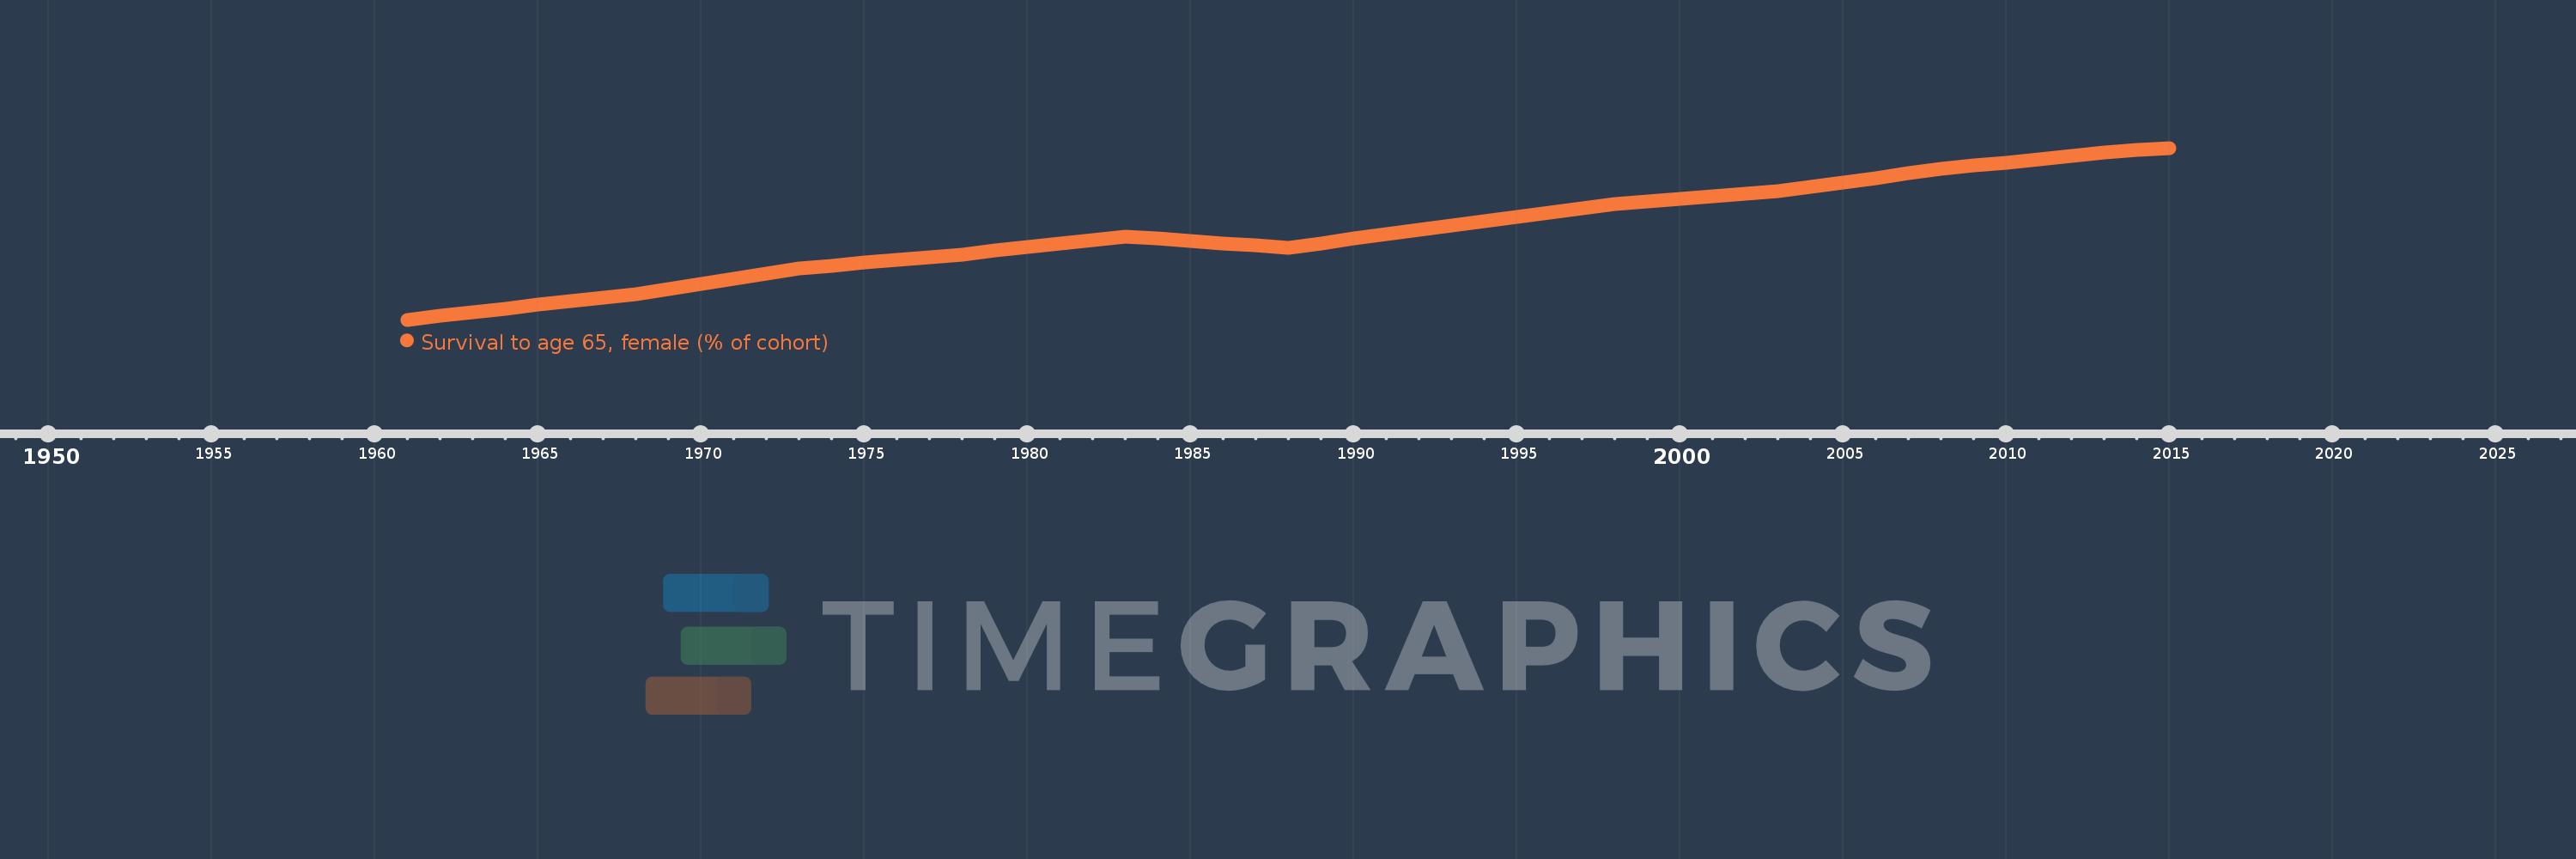
Survival to age 65, female (% of cohort)
2015,2014,2013,2012,2011,2010,2009,2008,2007,2006,2005,2004,2003,2002,2001,2000,1999,1998,1997,1996,1995,1994,1993,1992,1991,1990,1989,1988,1987,1986,1985,1984,1983,1982,1981,1980,1979,1978,1977,1976,1975,1974,1973,1972,1971,1970,1969,1968,1967,1966,1965,1964,1963,1962,1961
This statistics in other country:
AfghanistanAlbaniaAlgeriaAngolaAntigua and BarbudaArab WorldArgentinaArmeniaArubaAustraliaAustriaAzerbaijanBahamas, TheBahrainBangladeshBarbadosBelarusBelgiumBelizeBeninBhutanBoliviaBosnia and HerzegovinaBotswanaBrazilBrunei DarussalamBulgariaBurkina FasoBurundiCabo VerdeCambodiaCameroonCanadaCaribbean small statesCentral African RepublicCentral Europe and the BalticsChadChannel IslandsChileChinaColombiaComorosCongo, Dem. Rep.Congo, Rep.Costa RicaCote d'IvoireCroatiaCubaCuracaoCyprusCzech RepublicDenmarkDjiboutiDominican RepublicEarly-demographic dividendEast Asia & PacificEast Asia & Pacific (excluding high income)East Asia & Pacific (IDA & IBRD countries)EcuadorEgypt, Arab Rep.El SalvadorEquatorial GuineaEritreaEstoniaEthiopiaEuro areaEurope & Central AsiaEurope & Central Asia (excluding high income)Europe & Central Asia (IDA & IBRD countries)European UnionFijiFinlandFragile and conflict affected situationsFranceFrench PolynesiaGabonGambia, TheGeorgiaGermanyGhanaGreeceGrenadaGuamGuatemalaGuineaGuinea-BissauGuyanaHaitiHeavily indebted poor countries (HIPC)High incomeHondurasHong Kong SAR, ChinaHungaryIBRD onlyIcelandIDA & IBRD totalIDA blendIDA onlyIDA totalIndiaIndonesiaIran, Islamic Rep.IraqIrelandIsraelItalyJamaicaJapanJordanKazakhstanKenyaKiribatiKorea, Dem. People’s Rep.Korea, Rep.KuwaitKyrgyz RepublicLao PDRLate-demographic dividendLatin America & Caribbean Latin America & Caribbean (excluding high income)Latin America & the Caribbean (IDA & IBRD countries)LatviaLeast developed countries: UN classificationLebanonLesothoLiberiaLibyaLithuaniaLow & middle incomeLow incomeLower middle incomeLuxembourgMacao SAR, ChinaMacedonia, FYRMadagascarMalawiMalaysiaMaldivesMaliMaltaMauritaniaMauritiusMexicoMicronesia, Fed. Sts.Middle East & North AfricaMiddle East & North Africa (excluding high income)Middle East & North Africa (IDA & IBRD countries)Middle incomeMoldovaMongoliaMontenegroMoroccoMozambiqueMyanmarNamibiaNepalNetherlandsNew CaledoniaNew ZealandNicaraguaNigerNigeriaNorth AmericaNorwayOECD membersOmanOther small statesPacific island small statesPakistanPanamaPapua New GuineaParaguayPeruPhilippinesPolandPortugalPost-demographic dividendPre-demographic dividendPuerto RicoQatarRomaniaRussian FederationRwandaSamoaSao Tome and PrincipeSaudi ArabiaSenegalSerbiaSeychellesSierra LeoneSingaporeSlovak RepublicSloveniaSmall statesSolomon IslandsSomaliaSouth AfricaSouth AsiaSouth Asia (IDA & IBRD)South SudanSpainSri LankaSt. LuciaSt. Vincent and the GrenadinesSub-Saharan Africa Sub-Saharan Africa (excluding high income)Sub-Saharan Africa (IDA & IBRD countries)SudanSurinameSwazilandSwedenSwitzerlandSyrian Arab RepublicTajikistanTanzaniaThailandTimor-LesteTogoTongaTrinidad and TobagoTunisiaTurkeyTurkmenistanUgandaUkraineUnited Arab EmiratesUnited KingdomUnited StatesUpper middle incomeUruguayUzbekistanVanuatuVenezuela, RBVietnamVirgin Islands (U.S.)West Bank and GazaWorldYemen, Rep.ZambiaZimbabwe Timeline:
This timeline shows a graph from 1961 to 2015 of Norway. No data until 1960. Number of actual observations by date: 55.
Source name:
World Development Indicators
Source organization:
United Nations Population Division. World Population Prospects. New York, United Nations, Department of Economic and Social Affairs (advanced Excel tables). Available at http://esa.un.org/wpp/unpp/panel_population.htm.
Categories, topics:
Health, Gender
Last updated:
apr 23, 2017
Indicators value changes by year
Minimum:
84.936
jan 1, 1961
Maximum:
92.386
jan 1, 2015
At the date of observation
Value
Absolute change
Change from previous value
jan 1, 1961
84.936
+84.936
0.0%
jan 1, 1962
85.105
+0.17
0.2%
jan 1, 1963
85.275
+0.17
0.2%
jan 1, 1964
85.427
+0.151
0.18%
jan 1, 1965
85.578
+0.151
0.18%
jan 1, 1966
85.73
+0.151
0.18%
jan 1, 1967
85.881
+0.151
0.18%
jan 1, 1968
86.033
+0.151
0.18%
jan 1, 1969
86.26
+0.227
0.26%
jan 1, 1970
86.487
+0.227
0.26%
jan 1, 1971
86.715
+0.227
0.26%
jan 1, 1972
86.942
+0.227
0.26%
jan 1, 1973
87.169
+0.227
0.26%
jan 1, 1974
87.289
+0.12
0.14%
jan 1, 1975
87.408
+0.12
0.14%
jan 1, 1976
87.528
+0.12
0.14%
jan 1, 1977
87.648
+0.12
0.14%
jan 1, 1978
87.767
+0.12
0.14%
jan 1, 1979
87.924
+0.156
0.18%
jan 1, 1980
88.08
+0.156
0.18%
jan 1, 1981
88.236
+0.156
0.18%
jan 1, 1982
88.392
+0.156
0.18%
jan 1, 1983
88.548
+0.156
0.18%
jan 1, 1984
88.452
-0.097
-0.11%
jan 1, 1985
88.355
-0.097
-0.11%
jan 1, 1986
88.258
-0.097
-0.11%
jan 1, 1987
88.161
-0.097
-0.11%
jan 1, 1988
88.064
-0.097
-0.11%
jan 1, 1989
88.258
+0.194
0.22%
jan 1, 1990
88.452
+0.194
0.22%
jan 1, 1991
88.646
+0.194
0.22%
jan 1, 1992
88.839
+0.194
0.22%
jan 1, 1993
89.033
+0.194
0.22%
jan 1, 1994
89.218
+0.185
0.21%
jan 1, 1995
89.403
+0.185
0.21%
jan 1, 1996
89.588
+0.185
0.21%
jan 1, 1997
89.774
+0.185
0.21%
jan 1, 1998
89.959
+0.185
0.21%
jan 1, 1999
90.07
+0.111
0.12%
jan 1, 2000
90.181
+0.111
0.12%
jan 1, 2001
90.292
+0.111
0.12%
jan 1, 2002
90.403
+0.111
0.12%
jan 1, 2003
90.514
+0.111
0.12%
jan 1, 2004
90.705
+0.192
0.21%
jan 1, 2005
90.897
+0.192
0.21%
jan 1, 2006
91.089
+0.192
0.21%
jan 1, 2007
91.28
+0.192
0.21%
jan 1, 2008
91.472
+0.192
0.21%
jan 1, 2009
91.614
+0.142
0.16%
jan 1, 2010
91.756
+0.142
0.16%
jan 1, 2011
91.898
+0.142
0.15%
jan 1, 2012
92.04
+0.142
0.15%
jan 1, 2013
92.183
+0.142
0.15%
jan 1, 2014
92.284
+0.102
0.11%
jan 1, 2015
92.386
+0.102
0.11%
Ranking of countries by current statistics by years


Comments: