29
/
en
AIzaSyAYiBZKx7MnpbEhh9jyipgxe19OcubqV5w
April 1, 2024
287951
Zimbabwe
ZWE
true
2
1
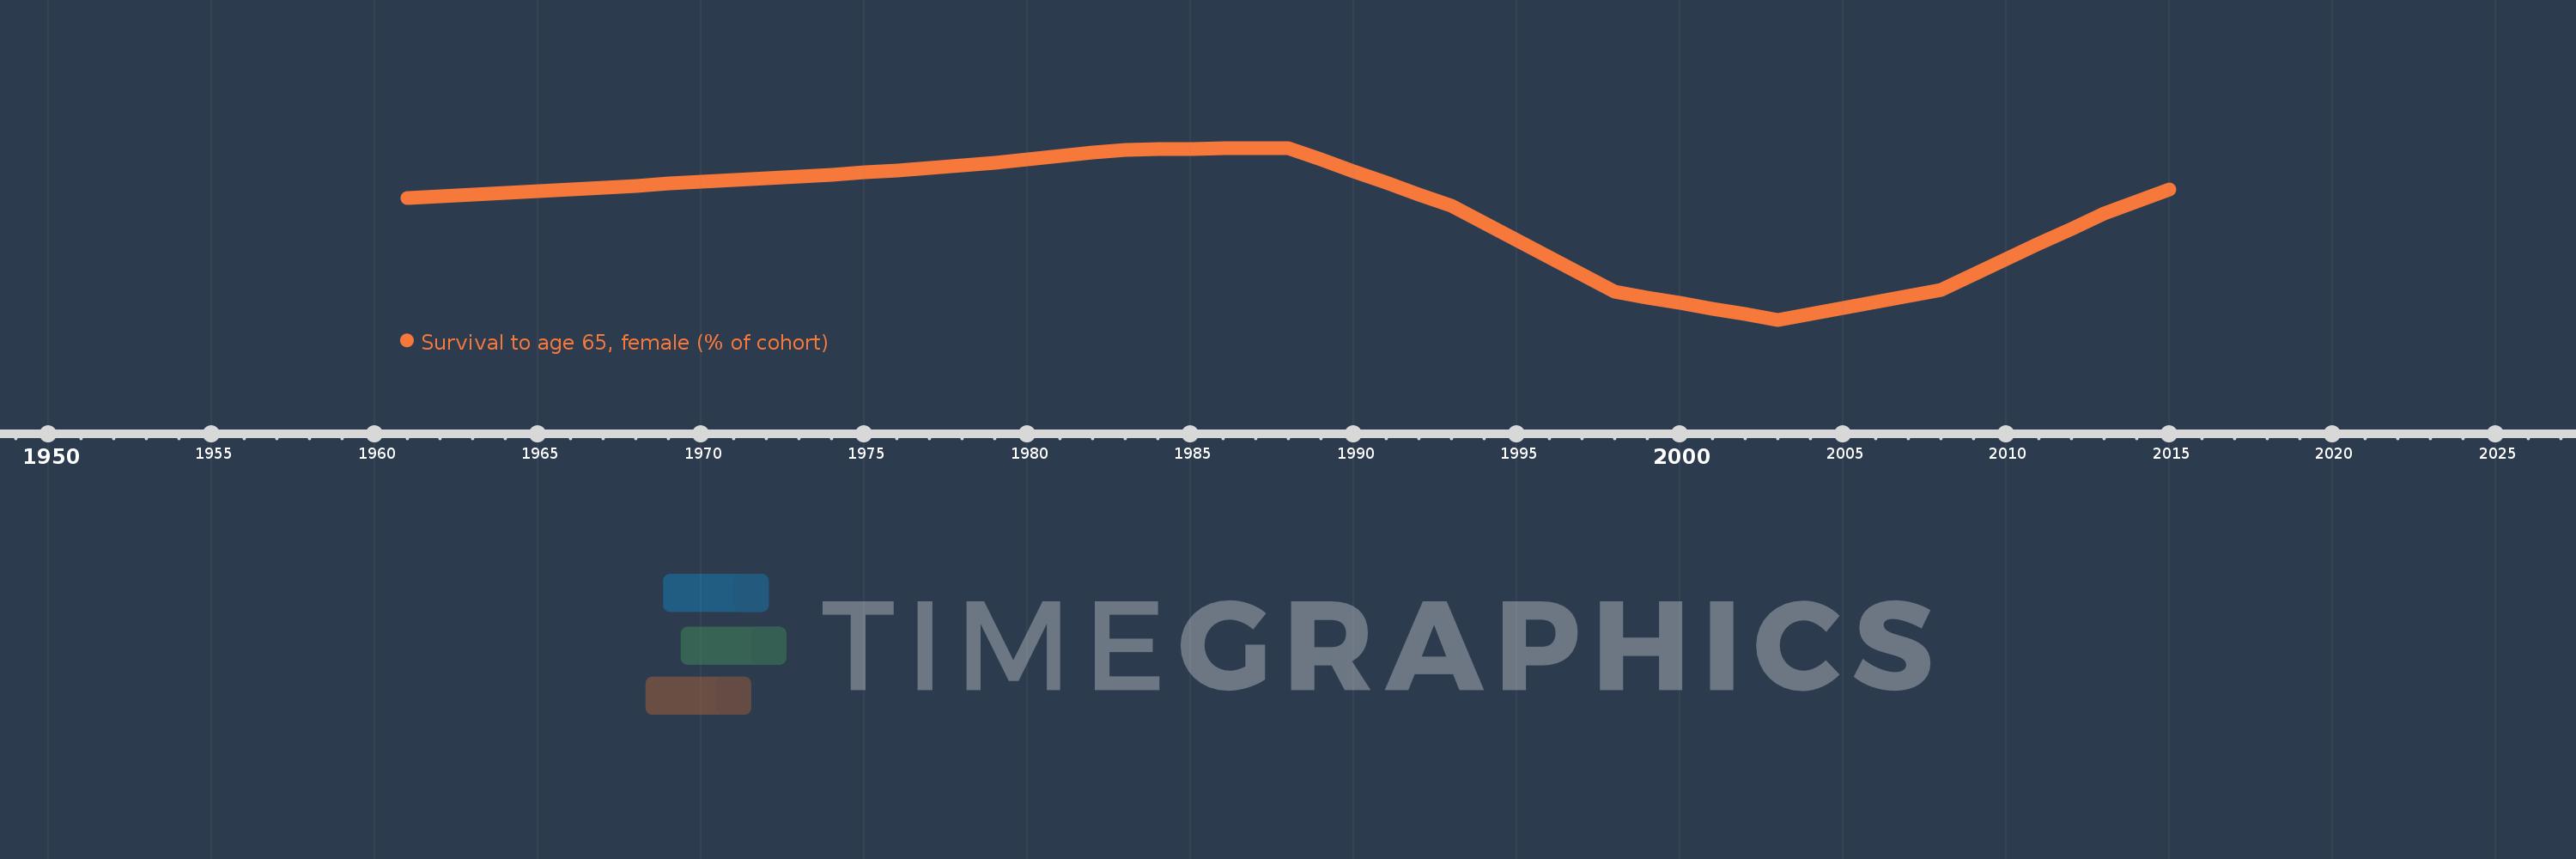
Survival to age 65, female (% of cohort)
2015,2014,2013,2012,2011,2010,2009,2008,2007,2006,2005,2004,2003,2002,2001,2000,1999,1998,1997,1996,1995,1994,1993,1992,1991,1990,1989,1988,1987,1986,1985,1984,1983,1982,1981,1980,1979,1978,1977,1976,1975,1974,1973,1972,1971,1970,1969,1968,1967,1966,1965,1964,1963,1962,1961
This statistics in other country:
AfghanistanAlbaniaAlgeriaAngolaAntigua and BarbudaArab WorldArgentinaArmeniaArubaAustraliaAustriaAzerbaijanBahamas, TheBahrainBangladeshBarbadosBelarusBelgiumBelizeBeninBhutanBoliviaBosnia and HerzegovinaBotswanaBrazilBrunei DarussalamBulgariaBurkina FasoBurundiCabo VerdeCambodiaCameroonCanadaCaribbean small statesCentral African RepublicCentral Europe and the BalticsChadChannel IslandsChileChinaColombiaComorosCongo, Dem. Rep.Congo, Rep.Costa RicaCote d'IvoireCroatiaCubaCuracaoCyprusCzech RepublicDenmarkDjiboutiDominican RepublicEarly-demographic dividendEast Asia & PacificEast Asia & Pacific (excluding high income)East Asia & Pacific (IDA & IBRD countries)EcuadorEgypt, Arab Rep.El SalvadorEquatorial GuineaEritreaEstoniaEthiopiaEuro areaEurope & Central AsiaEurope & Central Asia (excluding high income)Europe & Central Asia (IDA & IBRD countries)European UnionFijiFinlandFragile and conflict affected situationsFranceFrench PolynesiaGabonGambia, TheGeorgiaGermanyGhanaGreeceGrenadaGuamGuatemalaGuineaGuinea-BissauGuyanaHaitiHeavily indebted poor countries (HIPC)High incomeHondurasHong Kong SAR, ChinaHungaryIBRD onlyIcelandIDA & IBRD totalIDA blendIDA onlyIDA totalIndiaIndonesiaIran, Islamic Rep.IraqIrelandIsraelItalyJamaicaJapanJordanKazakhstanKenyaKiribatiKorea, Dem. People’s Rep.Korea, Rep.KuwaitKyrgyz RepublicLao PDRLate-demographic dividendLatin America & Caribbean Latin America & Caribbean (excluding high income)Latin America & the Caribbean (IDA & IBRD countries)LatviaLeast developed countries: UN classificationLebanonLesothoLiberiaLibyaLithuaniaLow & middle incomeLow incomeLower middle incomeLuxembourgMacao SAR, ChinaMacedonia, FYRMadagascarMalawiMalaysiaMaldivesMaliMaltaMauritaniaMauritiusMexicoMicronesia, Fed. Sts.Middle East & North AfricaMiddle East & North Africa (excluding high income)Middle East & North Africa (IDA & IBRD countries)Middle incomeMoldovaMongoliaMontenegroMoroccoMozambiqueMyanmarNamibiaNepalNetherlandsNew CaledoniaNew ZealandNicaraguaNigerNigeriaNorth AmericaNorwayOECD membersOmanOther small statesPacific island small statesPakistanPanamaPapua New GuineaParaguayPeruPhilippinesPolandPortugalPost-demographic dividendPre-demographic dividendPuerto RicoQatarRomaniaRussian FederationRwandaSamoaSao Tome and PrincipeSaudi ArabiaSenegalSerbiaSeychellesSierra LeoneSingaporeSlovak RepublicSloveniaSmall statesSolomon IslandsSomaliaSouth AfricaSouth AsiaSouth Asia (IDA & IBRD)South SudanSpainSri LankaSt. LuciaSt. Vincent and the GrenadinesSub-Saharan Africa Sub-Saharan Africa (excluding high income)Sub-Saharan Africa (IDA & IBRD countries)SudanSurinameSwazilandSwedenSwitzerlandSyrian Arab RepublicTajikistanTanzaniaThailandTimor-LesteTogoTongaTrinidad and TobagoTunisiaTurkeyTurkmenistanUgandaUkraineUnited Arab EmiratesUnited KingdomUnited StatesUpper middle incomeUruguayUzbekistanVanuatuVenezuela, RBVietnamVirgin Islands (U.S.)West Bank and GazaWorldYemen, Rep.ZambiaZimbabwe Timeline:
This timeline shows a graph from 1961 to 2015 of Zimbabwe. No data until 1960. Number of actual observations by date: 55.
Source name:
World Development Indicators
Source organization:
United Nations Population Division. World Population Prospects. New York, United Nations, Department of Economic and Social Affairs (advanced Excel tables). Available at http://esa.un.org/wpp/unpp/panel_population.htm.
Categories, topics:
Health, Gender
Last updated:
apr 23, 2017
Indicators value changes by year
Minimum:
14.897
jan 1, 2003
Maximum:
63.731
jan 1, 1988
At the date of observation
Value
Absolute change
Change from previous value
jan 1, 1961
49.478
+49.478
0.0%
jan 1, 1962
50.019
+0.541
1.09%
jan 1, 1963
50.56
+0.541
1.08%
jan 1, 1964
51.053
+0.493
0.98%
jan 1, 1965
51.546
+0.493
0.97%
jan 1, 1966
52.039
+0.493
0.96%
jan 1, 1967
52.532
+0.493
0.95%
jan 1, 1968
53.025
+0.493
0.94%
jan 1, 1969
53.525
+0.5
0.94%
jan 1, 1970
54.025
+0.5
0.93%
jan 1, 1971
54.526
+0.5
0.93%
jan 1, 1972
55.026
+0.5
0.92%
jan 1, 1973
55.526
+0.5
0.91%
jan 1, 1974
56.154
+0.629
1.13%
jan 1, 1975
56.783
+0.629
1.12%
jan 1, 1976
57.411
+0.629
1.11%
jan 1, 1977
58.04
+0.629
1.09%
jan 1, 1978
58.669
+0.629
1.08%
jan 1, 1979
59.593
+0.924
1.57%
jan 1, 1980
60.516
+0.924
1.55%
jan 1, 1981
61.44
+0.924
1.53%
jan 1, 1982
62.364
+0.924
1.5%
jan 1, 1983
63.288
+0.924
1.48%
jan 1, 1984
63.377
+0.089
0.14%
jan 1, 1985
63.465
+0.089
0.14%
jan 1, 1986
63.554
+0.089
0.14%
jan 1, 1987
63.642
+0.089
0.14%
jan 1, 1988
63.731
+0.089
0.14%
jan 1, 1989
60.437
-3.294
-5.17%
jan 1, 1990
57.144
-3.294
-5.45%
jan 1, 1991
53.85
-3.294
-5.76%
jan 1, 1992
50.557
-3.294
-6.12%
jan 1, 1993
47.263
-3.294
-6.51%
jan 1, 1994
42.385
-4.879
-10.32%
jan 1, 1995
37.506
-4.879
-11.51%
jan 1, 1996
32.628
-4.879
-13.01%
jan 1, 1997
27.749
-4.879
-14.95%
jan 1, 1998
22.871
-4.879
-17.58%
jan 1, 1999
21.276
-1.595
-6.97%
jan 1, 2000
19.681
-1.595
-7.5%
jan 1, 2001
18.086
-1.595
-8.1%
jan 1, 2002
16.492
-1.595
-8.82%
jan 1, 2003
14.897
-1.595
-9.67%
jan 1, 2004
16.601
+1.704
11.44%
jan 1, 2005
18.305
+1.704
10.27%
jan 1, 2006
20.009
+1.704
9.31%
jan 1, 2007
21.714
+1.704
8.52%
jan 1, 2008
23.418
+1.704
7.85%
jan 1, 2009
27.768
+4.35
18.58%
jan 1, 2010
32.118
+4.35
15.67%
jan 1, 2011
36.468
+4.35
13.54%
jan 1, 2012
40.818
+4.35
11.93%
jan 1, 2013
45.168
+4.35
10.66%
jan 1, 2014
48.497
+3.329
7.37%
jan 1, 2015
51.827
+3.329
6.86%
Ranking of countries by current statistics by years


Comments: