29
/
en
AIzaSyAYiBZKx7MnpbEhh9jyipgxe19OcubqV5w
April 1, 2024
134631
France
FRA
true
2
1
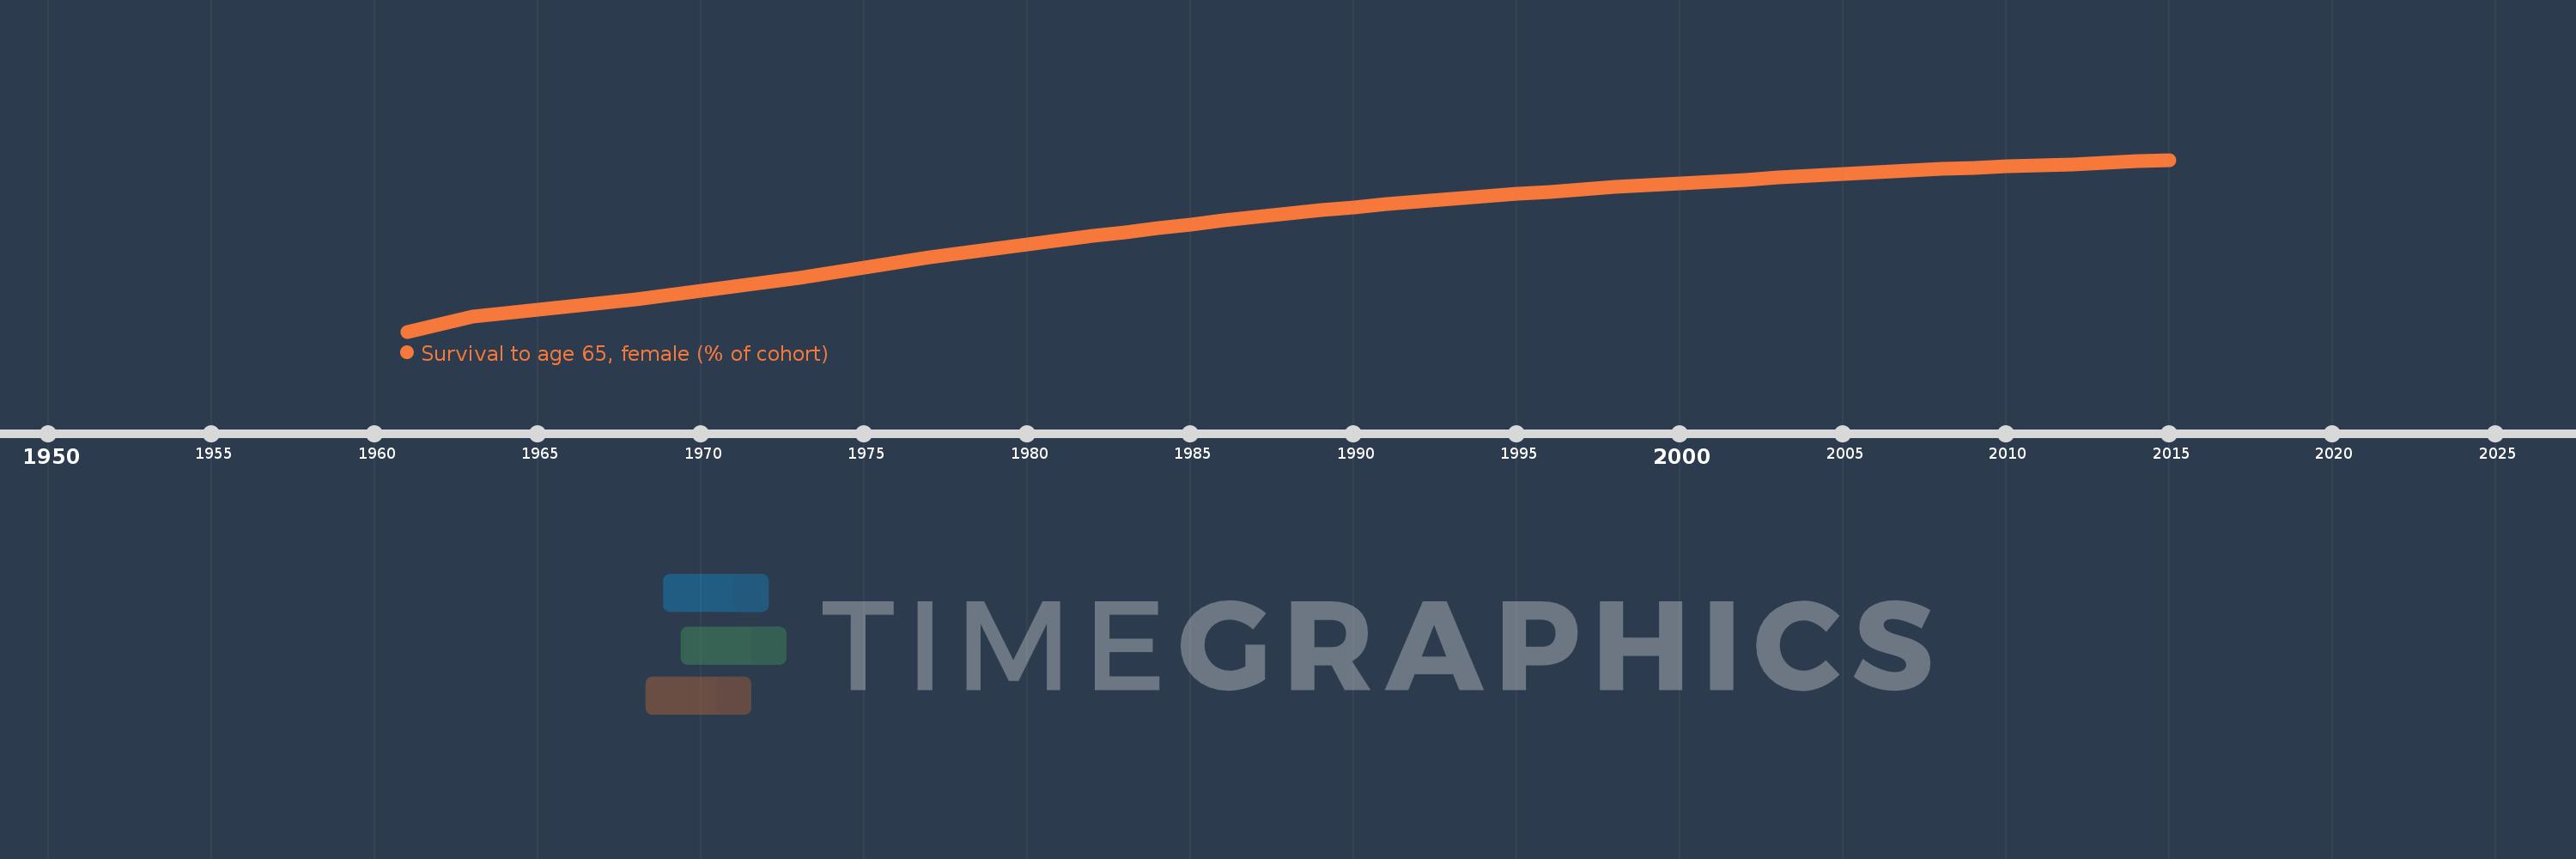
Survival to age 65, female (% of cohort)
2015,2014,2013,2012,2011,2010,2009,2008,2007,2006,2005,2004,2003,2002,2001,2000,1999,1998,1997,1996,1995,1994,1993,1992,1991,1990,1989,1988,1987,1986,1985,1984,1983,1982,1981,1980,1979,1978,1977,1976,1975,1974,1973,1972,1971,1970,1969,1968,1967,1966,1965,1964,1963,1962,1961
This statistics in other country:
AfghanistanAlbaniaAlgeriaAngolaAntigua and BarbudaArab WorldArgentinaArmeniaArubaAustraliaAustriaAzerbaijanBahamas, TheBahrainBangladeshBarbadosBelarusBelgiumBelizeBeninBhutanBoliviaBosnia and HerzegovinaBotswanaBrazilBrunei DarussalamBulgariaBurkina FasoBurundiCabo VerdeCambodiaCameroonCanadaCaribbean small statesCentral African RepublicCentral Europe and the BalticsChadChannel IslandsChileChinaColombiaComorosCongo, Dem. Rep.Congo, Rep.Costa RicaCote d'IvoireCroatiaCubaCuracaoCyprusCzech RepublicDenmarkDjiboutiDominican RepublicEarly-demographic dividendEast Asia & PacificEast Asia & Pacific (excluding high income)East Asia & Pacific (IDA & IBRD countries)EcuadorEgypt, Arab Rep.El SalvadorEquatorial GuineaEritreaEstoniaEthiopiaEuro areaEurope & Central AsiaEurope & Central Asia (excluding high income)Europe & Central Asia (IDA & IBRD countries)European UnionFijiFinlandFragile and conflict affected situationsFranceFrench PolynesiaGabonGambia, TheGeorgiaGermanyGhanaGreeceGrenadaGuamGuatemalaGuineaGuinea-BissauGuyanaHaitiHeavily indebted poor countries (HIPC)High incomeHondurasHong Kong SAR, ChinaHungaryIBRD onlyIcelandIDA & IBRD totalIDA blendIDA onlyIDA totalIndiaIndonesiaIran, Islamic Rep.IraqIrelandIsraelItalyJamaicaJapanJordanKazakhstanKenyaKiribatiKorea, Dem. People’s Rep.Korea, Rep.KuwaitKyrgyz RepublicLao PDRLate-demographic dividendLatin America & Caribbean Latin America & Caribbean (excluding high income)Latin America & the Caribbean (IDA & IBRD countries)LatviaLeast developed countries: UN classificationLebanonLesothoLiberiaLibyaLithuaniaLow & middle incomeLow incomeLower middle incomeLuxembourgMacao SAR, ChinaMacedonia, FYRMadagascarMalawiMalaysiaMaldivesMaliMaltaMauritaniaMauritiusMexicoMicronesia, Fed. Sts.Middle East & North AfricaMiddle East & North Africa (excluding high income)Middle East & North Africa (IDA & IBRD countries)Middle incomeMoldovaMongoliaMontenegroMoroccoMozambiqueMyanmarNamibiaNepalNetherlandsNew CaledoniaNew ZealandNicaraguaNigerNigeriaNorth AmericaNorwayOECD membersOmanOther small statesPacific island small statesPakistanPanamaPapua New GuineaParaguayPeruPhilippinesPolandPortugalPost-demographic dividendPre-demographic dividendPuerto RicoQatarRomaniaRussian FederationRwandaSamoaSao Tome and PrincipeSaudi ArabiaSenegalSerbiaSeychellesSierra LeoneSingaporeSlovak RepublicSloveniaSmall statesSolomon IslandsSomaliaSouth AfricaSouth AsiaSouth Asia (IDA & IBRD)South SudanSpainSri LankaSt. LuciaSt. Vincent and the GrenadinesSub-Saharan Africa Sub-Saharan Africa (excluding high income)Sub-Saharan Africa (IDA & IBRD countries)SudanSurinameSwazilandSwedenSwitzerlandSyrian Arab RepublicTajikistanTanzaniaThailandTimor-LesteTogoTongaTrinidad and TobagoTunisiaTurkeyTurkmenistanUgandaUkraineUnited Arab EmiratesUnited KingdomUnited StatesUpper middle incomeUruguayUzbekistanVanuatuVenezuela, RBVietnamVirgin Islands (U.S.)West Bank and GazaWorldYemen, Rep.ZambiaZimbabwe Timeline:
This timeline shows a graph from 1961 to 2015 of France. No data until 1960. Number of actual observations by date: 55.
Source name:
World Development Indicators
Source organization:
United Nations Population Division. World Population Prospects. New York, United Nations, Department of Economic and Social Affairs (advanced Excel tables). Available at http://esa.un.org/wpp/unpp/panel_population.htm.
Categories, topics:
Health, Gender
Last updated:
apr 23, 2017
Indicators value changes by year
Minimum:
80.213
jan 1, 1961
Maximum:
92.213
jan 1, 2015
At the date of observation
Value
Absolute change
Change from previous value
jan 1, 1961
80.213
+80.213
0.0%
jan 1, 1962
80.724
+0.511
0.64%
jan 1, 1963
81.235
+0.511
0.63%
jan 1, 1964
81.476
+0.241
0.3%
jan 1, 1965
81.717
+0.241
0.3%
jan 1, 1966
81.958
+0.241
0.29%
jan 1, 1967
82.199
+0.241
0.29%
jan 1, 1968
82.44
+0.241
0.29%
jan 1, 1969
82.742
+0.302
0.37%
jan 1, 1970
83.045
+0.302
0.37%
jan 1, 1971
83.347
+0.302
0.36%
jan 1, 1972
83.65
+0.302
0.36%
jan 1, 1973
83.952
+0.302
0.36%
jan 1, 1974
84.308
+0.356
0.42%
jan 1, 1975
84.664
+0.356
0.42%
jan 1, 1976
85.02
+0.356
0.42%
jan 1, 1977
85.376
+0.356
0.42%
jan 1, 1978
85.732
+0.356
0.42%
jan 1, 1979
86.018
+0.286
0.33%
jan 1, 1980
86.304
+0.286
0.33%
jan 1, 1981
86.59
+0.286
0.33%
jan 1, 1982
86.877
+0.286
0.33%
jan 1, 1983
87.163
+0.286
0.33%
jan 1, 1984
87.427
+0.264
0.3%
jan 1, 1985
87.691
+0.264
0.3%
jan 1, 1986
87.955
+0.264
0.3%
jan 1, 1987
88.219
+0.264
0.3%
jan 1, 1988
88.483
+0.264
0.3%
jan 1, 1989
88.687
+0.204
0.23%
jan 1, 1990
88.891
+0.204
0.23%
jan 1, 1991
89.095
+0.204
0.23%
jan 1, 1992
89.299
+0.204
0.23%
jan 1, 1993
89.503
+0.204
0.23%
jan 1, 1994
89.662
+0.159
0.18%
jan 1, 1995
89.821
+0.159
0.18%
jan 1, 1996
89.98
+0.159
0.18%
jan 1, 1997
90.138
+0.159
0.18%
jan 1, 1998
90.297
+0.159
0.18%
jan 1, 1999
90.431
+0.133
0.15%
jan 1, 2000
90.564
+0.133
0.15%
jan 1, 2001
90.698
+0.133
0.15%
jan 1, 2002
90.831
+0.133
0.15%
jan 1, 2003
90.965
+0.133
0.15%
jan 1, 2004
91.089
+0.125
0.14%
jan 1, 2005
91.214
+0.125
0.14%
jan 1, 2006
91.338
+0.125
0.14%
jan 1, 2007
91.463
+0.125
0.14%
jan 1, 2008
91.587
+0.125
0.14%
jan 1, 2009
91.665
+0.078
0.09%
jan 1, 2010
91.743
+0.078
0.08%
jan 1, 2011
91.821
+0.078
0.08%
jan 1, 2012
91.899
+0.078
0.08%
jan 1, 2013
91.977
+0.078
0.08%
jan 1, 2014
92.095
+0.118
0.13%
jan 1, 2015
92.213
+0.118
0.13%
Ranking of countries by current statistics by years


Comments: