29
/
en
AIzaSyAYiBZKx7MnpbEhh9jyipgxe19OcubqV5w
April 1, 2024
197007
Micronesia, Fed. Sts.
FSM
true
2
1
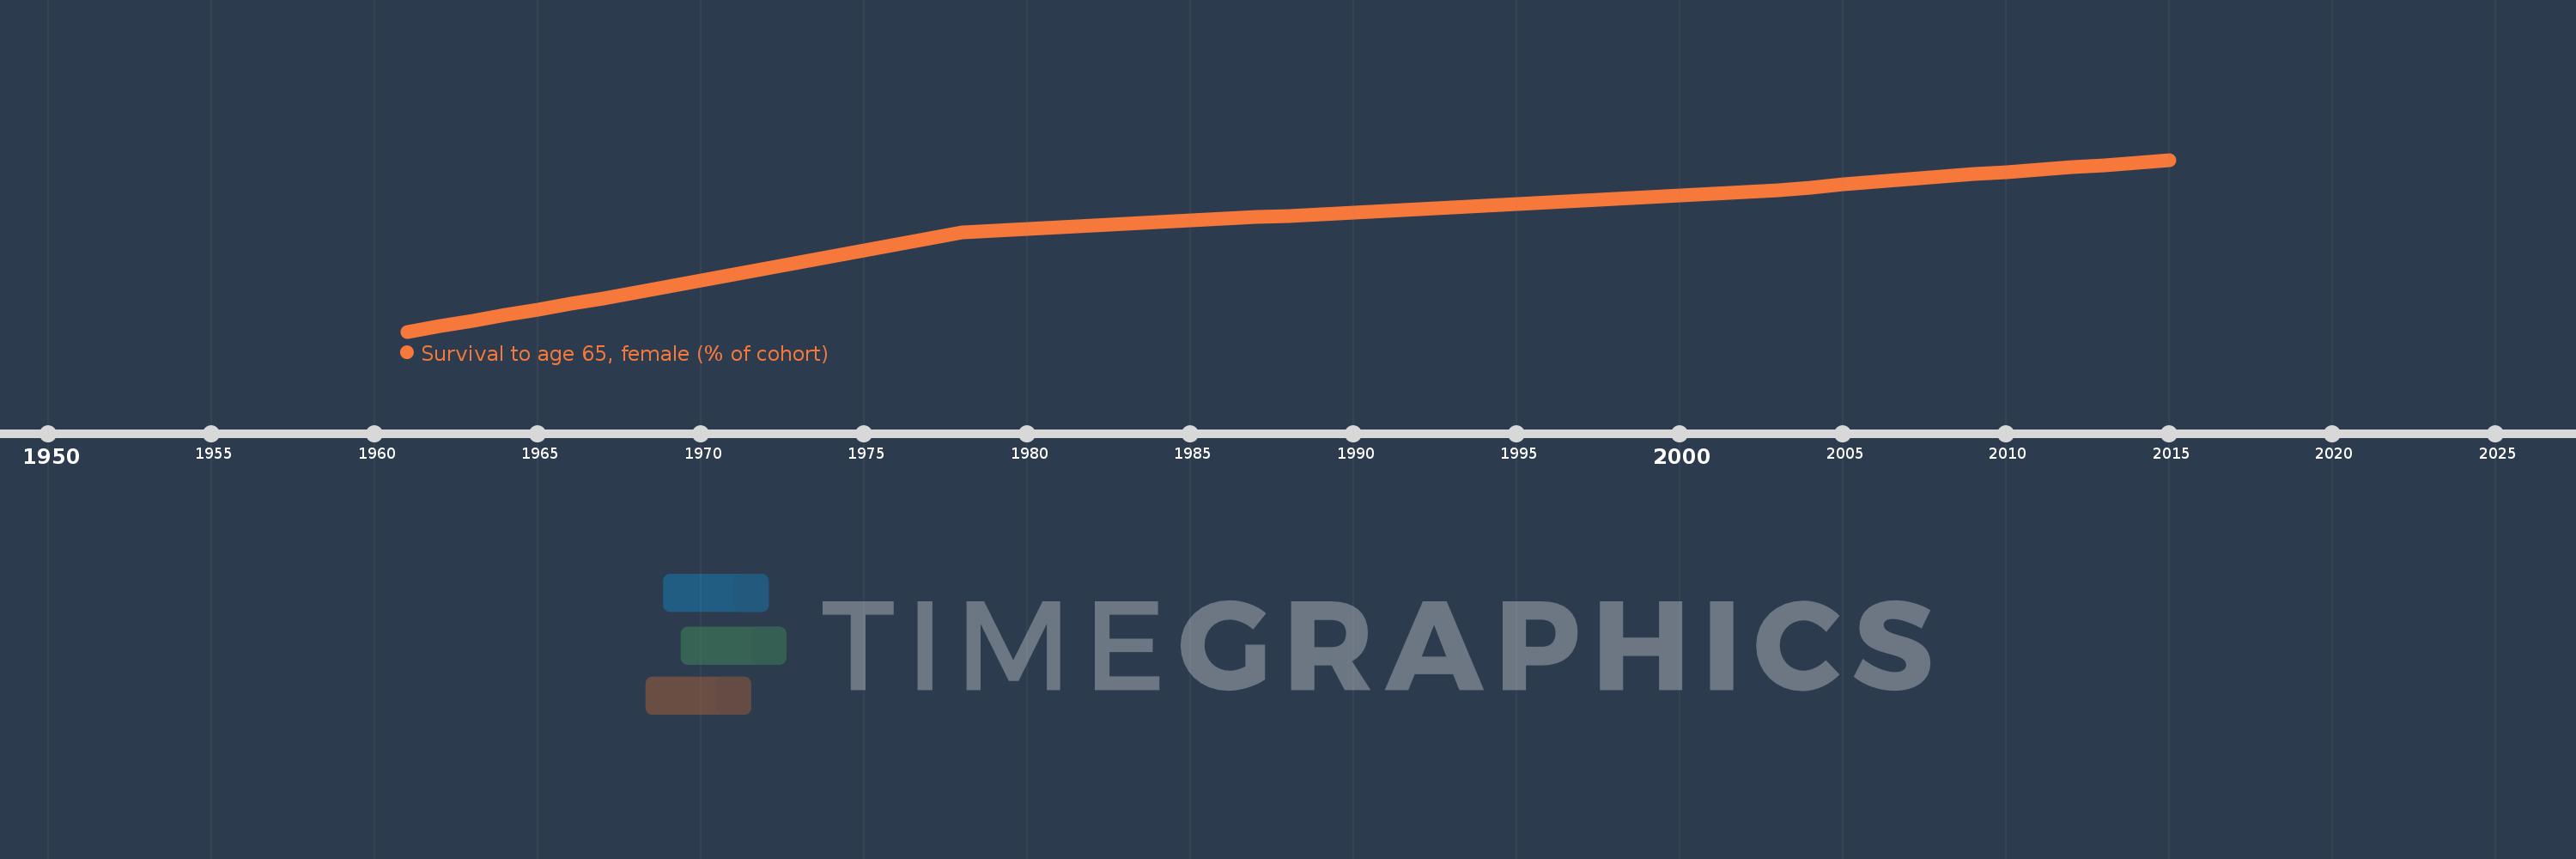
Survival to age 65, female (% of cohort)
2015,2014,2013,2012,2011,2010,2009,2008,2007,2006,2005,2004,2003,2002,2001,2000,1999,1998,1997,1996,1995,1994,1993,1992,1991,1990,1989,1988,1987,1986,1985,1984,1983,1982,1981,1980,1979,1978,1977,1976,1975,1974,1973,1972,1971,1970,1969,1968,1967,1966,1965,1964,1963,1962,1961
This statistics in other country:
AfghanistanAlbaniaAlgeriaAngolaAntigua and BarbudaArab WorldArgentinaArmeniaArubaAustraliaAustriaAzerbaijanBahamas, TheBahrainBangladeshBarbadosBelarusBelgiumBelizeBeninBhutanBoliviaBosnia and HerzegovinaBotswanaBrazilBrunei DarussalamBulgariaBurkina FasoBurundiCabo VerdeCambodiaCameroonCanadaCaribbean small statesCentral African RepublicCentral Europe and the BalticsChadChannel IslandsChileChinaColombiaComorosCongo, Dem. Rep.Congo, Rep.Costa RicaCote d'IvoireCroatiaCubaCuracaoCyprusCzech RepublicDenmarkDjiboutiDominican RepublicEarly-demographic dividendEast Asia & PacificEast Asia & Pacific (excluding high income)East Asia & Pacific (IDA & IBRD countries)EcuadorEgypt, Arab Rep.El SalvadorEquatorial GuineaEritreaEstoniaEthiopiaEuro areaEurope & Central AsiaEurope & Central Asia (excluding high income)Europe & Central Asia (IDA & IBRD countries)European UnionFijiFinlandFragile and conflict affected situationsFranceFrench PolynesiaGabonGambia, TheGeorgiaGermanyGhanaGreeceGrenadaGuamGuatemalaGuineaGuinea-BissauGuyanaHaitiHeavily indebted poor countries (HIPC)High incomeHondurasHong Kong SAR, ChinaHungaryIBRD onlyIcelandIDA & IBRD totalIDA blendIDA onlyIDA totalIndiaIndonesiaIran, Islamic Rep.IraqIrelandIsraelItalyJamaicaJapanJordanKazakhstanKenyaKiribatiKorea, Dem. People’s Rep.Korea, Rep.KuwaitKyrgyz RepublicLao PDRLate-demographic dividendLatin America & Caribbean Latin America & Caribbean (excluding high income)Latin America & the Caribbean (IDA & IBRD countries)LatviaLeast developed countries: UN classificationLebanonLesothoLiberiaLibyaLithuaniaLow & middle incomeLow incomeLower middle incomeLuxembourgMacao SAR, ChinaMacedonia, FYRMadagascarMalawiMalaysiaMaldivesMaliMaltaMauritaniaMauritiusMexicoMicronesia, Fed. Sts.Middle East & North AfricaMiddle East & North Africa (excluding high income)Middle East & North Africa (IDA & IBRD countries)Middle incomeMoldovaMongoliaMontenegroMoroccoMozambiqueMyanmarNamibiaNepalNetherlandsNew CaledoniaNew ZealandNicaraguaNigerNigeriaNorth AmericaNorwayOECD membersOmanOther small statesPacific island small statesPakistanPanamaPapua New GuineaParaguayPeruPhilippinesPolandPortugalPost-demographic dividendPre-demographic dividendPuerto RicoQatarRomaniaRussian FederationRwandaSamoaSao Tome and PrincipeSaudi ArabiaSenegalSerbiaSeychellesSierra LeoneSingaporeSlovak RepublicSloveniaSmall statesSolomon IslandsSomaliaSouth AfricaSouth AsiaSouth Asia (IDA & IBRD)South SudanSpainSri LankaSt. LuciaSt. Vincent and the GrenadinesSub-Saharan Africa Sub-Saharan Africa (excluding high income)Sub-Saharan Africa (IDA & IBRD countries)SudanSurinameSwazilandSwedenSwitzerlandSyrian Arab RepublicTajikistanTanzaniaThailandTimor-LesteTogoTongaTrinidad and TobagoTunisiaTurkeyTurkmenistanUgandaUkraineUnited Arab EmiratesUnited KingdomUnited StatesUpper middle incomeUruguayUzbekistanVanuatuVenezuela, RBVietnamVirgin Islands (U.S.)West Bank and GazaWorldYemen, Rep.ZambiaZimbabwe Timeline:
This timeline shows a graph from 1961 to 2015 of Micronesia, Fed. Sts.. No data until 1960. Number of actual observations by date: 55.
Source name:
World Development Indicators
Source organization:
United Nations Population Division. World Population Prospects. New York, United Nations, Department of Economic and Social Affairs (advanced Excel tables). Available at http://esa.un.org/wpp/unpp/panel_population.htm.
Categories, topics:
Health, Gender
Last updated:
apr 23, 2017
Indicators value changes by year
Minimum:
55.675
jan 1, 1961
Maximum:
74.938
jan 1, 2015
At the date of observation
Value
Absolute change
Change from previous value
jan 1, 1961
55.675
+55.675
0.0%
jan 1, 1962
56.292
+0.617
1.11%
jan 1, 1963
56.91
+0.617
1.1%
jan 1, 1964
57.539
+0.629
1.11%
jan 1, 1965
58.168
+0.629
1.09%
jan 1, 1966
58.798
+0.629
1.08%
jan 1, 1967
59.427
+0.629
1.07%
jan 1, 1968
60.056
+0.629
1.06%
jan 1, 1969
60.728
+0.672
1.12%
jan 1, 1970
61.4
+0.672
1.11%
jan 1, 1971
62.071
+0.672
1.09%
jan 1, 1972
62.743
+0.672
1.08%
jan 1, 1973
63.415
+0.672
1.07%
jan 1, 1974
64.096
+0.682
1.08%
jan 1, 1975
64.778
+0.682
1.06%
jan 1, 1976
65.46
+0.682
1.05%
jan 1, 1977
66.142
+0.682
1.04%
jan 1, 1978
66.823
+0.682
1.03%
jan 1, 1979
67.006
+0.183
0.27%
jan 1, 1980
67.189
+0.183
0.27%
jan 1, 1981
67.371
+0.183
0.27%
jan 1, 1982
67.554
+0.183
0.27%
jan 1, 1983
67.736
+0.183
0.27%
jan 1, 1984
67.924
+0.187
0.28%
jan 1, 1985
68.111
+0.187
0.28%
jan 1, 1986
68.298
+0.187
0.28%
jan 1, 1987
68.486
+0.187
0.27%
jan 1, 1988
68.673
+0.187
0.27%
jan 1, 1989
68.859
+0.186
0.27%
jan 1, 1990
69.044
+0.186
0.27%
jan 1, 1991
69.23
+0.186
0.27%
jan 1, 1992
69.415
+0.186
0.27%
jan 1, 1993
69.601
+0.186
0.27%
jan 1, 1994
69.787
+0.187
0.27%
jan 1, 1995
69.974
+0.187
0.27%
jan 1, 1996
70.161
+0.187
0.27%
jan 1, 1997
70.348
+0.187
0.27%
jan 1, 1998
70.534
+0.187
0.27%
jan 1, 1999
70.735
+0.201
0.28%
jan 1, 2000
70.936
+0.201
0.28%
jan 1, 2001
71.136
+0.201
0.28%
jan 1, 2002
71.337
+0.201
0.28%
jan 1, 2003
71.538
+0.201
0.28%
jan 1, 2004
71.845
+0.308
0.43%
jan 1, 2005
72.153
+0.308
0.43%
jan 1, 2006
72.46
+0.308
0.43%
jan 1, 2007
72.768
+0.307
0.42%
jan 1, 2008
73.075
+0.308
0.42%
jan 1, 2009
73.327
+0.252
0.34%
jan 1, 2010
73.579
+0.252
0.34%
jan 1, 2011
73.831
+0.252
0.34%
jan 1, 2012
74.083
+0.252
0.34%
jan 1, 2013
74.335
+0.252
0.34%
jan 1, 2014
74.636
+0.301
0.41%
jan 1, 2015
74.938
+0.301
0.4%
Ranking of countries by current statistics by years


Comments: