29
/
en
AIzaSyAYiBZKx7MnpbEhh9jyipgxe19OcubqV5w
April 1, 2024
254671
Suriname
SUR
true
2
1
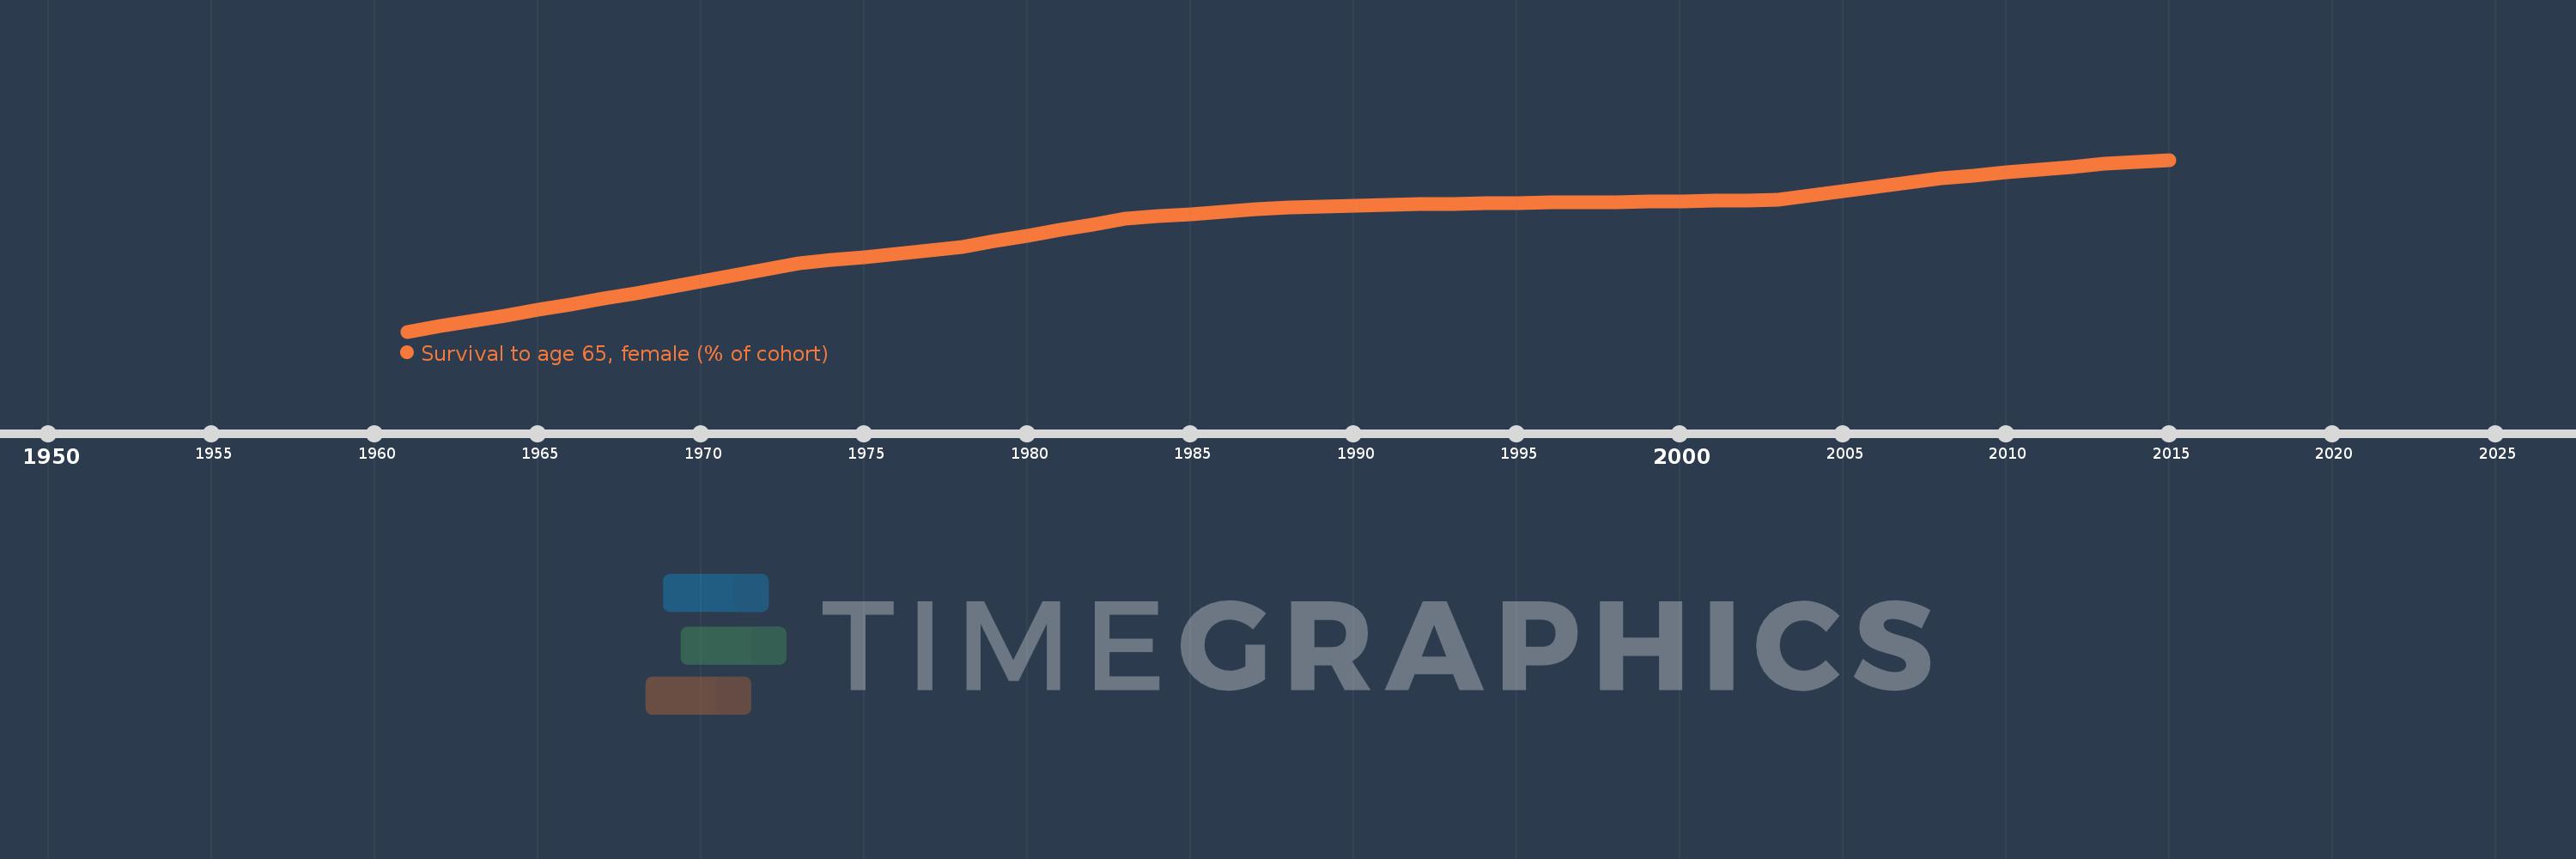
Survival to age 65, female (% of cohort)
2015,2014,2013,2012,2011,2010,2009,2008,2007,2006,2005,2004,2003,2002,2001,2000,1999,1998,1997,1996,1995,1994,1993,1992,1991,1990,1989,1988,1987,1986,1985,1984,1983,1982,1981,1980,1979,1978,1977,1976,1975,1974,1973,1972,1971,1970,1969,1968,1967,1966,1965,1964,1963,1962,1961
This statistics in other country:
AfghanistanAlbaniaAlgeriaAngolaAntigua and BarbudaArab WorldArgentinaArmeniaArubaAustraliaAustriaAzerbaijanBahamas, TheBahrainBangladeshBarbadosBelarusBelgiumBelizeBeninBhutanBoliviaBosnia and HerzegovinaBotswanaBrazilBrunei DarussalamBulgariaBurkina FasoBurundiCabo VerdeCambodiaCameroonCanadaCaribbean small statesCentral African RepublicCentral Europe and the BalticsChadChannel IslandsChileChinaColombiaComorosCongo, Dem. Rep.Congo, Rep.Costa RicaCote d'IvoireCroatiaCubaCuracaoCyprusCzech RepublicDenmarkDjiboutiDominican RepublicEarly-demographic dividendEast Asia & PacificEast Asia & Pacific (excluding high income)East Asia & Pacific (IDA & IBRD countries)EcuadorEgypt, Arab Rep.El SalvadorEquatorial GuineaEritreaEstoniaEthiopiaEuro areaEurope & Central AsiaEurope & Central Asia (excluding high income)Europe & Central Asia (IDA & IBRD countries)European UnionFijiFinlandFragile and conflict affected situationsFranceFrench PolynesiaGabonGambia, TheGeorgiaGermanyGhanaGreeceGrenadaGuamGuatemalaGuineaGuinea-BissauGuyanaHaitiHeavily indebted poor countries (HIPC)High incomeHondurasHong Kong SAR, ChinaHungaryIBRD onlyIcelandIDA & IBRD totalIDA blendIDA onlyIDA totalIndiaIndonesiaIran, Islamic Rep.IraqIrelandIsraelItalyJamaicaJapanJordanKazakhstanKenyaKiribatiKorea, Dem. People’s Rep.Korea, Rep.KuwaitKyrgyz RepublicLao PDRLate-demographic dividendLatin America & Caribbean Latin America & Caribbean (excluding high income)Latin America & the Caribbean (IDA & IBRD countries)LatviaLeast developed countries: UN classificationLebanonLesothoLiberiaLibyaLithuaniaLow & middle incomeLow incomeLower middle incomeLuxembourgMacao SAR, ChinaMacedonia, FYRMadagascarMalawiMalaysiaMaldivesMaliMaltaMauritaniaMauritiusMexicoMicronesia, Fed. Sts.Middle East & North AfricaMiddle East & North Africa (excluding high income)Middle East & North Africa (IDA & IBRD countries)Middle incomeMoldovaMongoliaMontenegroMoroccoMozambiqueMyanmarNamibiaNepalNetherlandsNew CaledoniaNew ZealandNicaraguaNigerNigeriaNorth AmericaNorwayOECD membersOmanOther small statesPacific island small statesPakistanPanamaPapua New GuineaParaguayPeruPhilippinesPolandPortugalPost-demographic dividendPre-demographic dividendPuerto RicoQatarRomaniaRussian FederationRwandaSamoaSao Tome and PrincipeSaudi ArabiaSenegalSerbiaSeychellesSierra LeoneSingaporeSlovak RepublicSloveniaSmall statesSolomon IslandsSomaliaSouth AfricaSouth AsiaSouth Asia (IDA & IBRD)South SudanSpainSri LankaSt. LuciaSt. Vincent and the GrenadinesSub-Saharan Africa Sub-Saharan Africa (excluding high income)Sub-Saharan Africa (IDA & IBRD countries)SudanSurinameSwazilandSwedenSwitzerlandSyrian Arab RepublicTajikistanTanzaniaThailandTimor-LesteTogoTongaTrinidad and TobagoTunisiaTurkeyTurkmenistanUgandaUkraineUnited Arab EmiratesUnited KingdomUnited StatesUpper middle incomeUruguayUzbekistanVanuatuVenezuela, RBVietnamVirgin Islands (U.S.)West Bank and GazaWorldYemen, Rep.ZambiaZimbabwe Timeline:
This timeline shows a graph from 1961 to 2015 of Suriname. No data until 1960. Number of actual observations by date: 55.
Source name:
World Development Indicators
Source organization:
United Nations Population Division. World Population Prospects. New York, United Nations, Department of Economic and Social Affairs (advanced Excel tables). Available at http://esa.un.org/wpp/unpp/panel_population.htm.
Categories, topics:
Health, Gender
Last updated:
apr 23, 2017
Indicators value changes by year
Minimum:
59.826
jan 1, 1961
Maximum:
80.019
jan 1, 2015
At the date of observation
Value
Absolute change
Change from previous value
jan 1, 1961
59.826
+59.826
0.0%
jan 1, 1962
60.432
+0.606
1.01%
jan 1, 1963
61.039
+0.606
1.0%
jan 1, 1964
61.705
+0.666
1.09%
jan 1, 1965
62.37
+0.666
1.08%
jan 1, 1966
63.036
+0.666
1.07%
jan 1, 1967
63.702
+0.666
1.06%
jan 1, 1968
64.368
+0.666
1.05%
jan 1, 1969
65.056
+0.688
1.07%
jan 1, 1970
65.744
+0.688
1.06%
jan 1, 1971
66.432
+0.688
1.05%
jan 1, 1972
67.12
+0.688
1.04%
jan 1, 1973
67.809
+0.688
1.03%
jan 1, 1974
68.208
+0.4
0.59%
jan 1, 1975
68.608
+0.4
0.59%
jan 1, 1976
69.008
+0.4
0.58%
jan 1, 1977
69.408
+0.4
0.58%
jan 1, 1978
69.808
+0.4
0.58%
jan 1, 1979
70.465
+0.657
0.94%
jan 1, 1980
71.122
+0.657
0.93%
jan 1, 1981
71.779
+0.657
0.92%
jan 1, 1982
72.436
+0.657
0.92%
jan 1, 1983
73.093
+0.657
0.91%
jan 1, 1984
73.363
+0.269
0.37%
jan 1, 1985
73.632
+0.269
0.37%
jan 1, 1986
73.902
+0.269
0.37%
jan 1, 1987
74.171
+0.269
0.36%
jan 1, 1988
74.441
+0.269
0.36%
jan 1, 1989
74.524
+0.084
0.11%
jan 1, 1990
74.608
+0.084
0.11%
jan 1, 1991
74.692
+0.084
0.11%
jan 1, 1992
74.776
+0.084
0.11%
jan 1, 1993
74.859
+0.084
0.11%
jan 1, 1994
74.898
+0.038
0.05%
jan 1, 1995
74.936
+0.038
0.05%
jan 1, 1996
74.974
+0.038
0.05%
jan 1, 1997
75.012
+0.038
0.05%
jan 1, 1998
75.051
+0.038
0.05%
jan 1, 1999
75.103
+0.052
0.07%
jan 1, 2000
75.155
+0.052
0.07%
jan 1, 2001
75.207
+0.052
0.07%
jan 1, 2002
75.259
+0.052
0.07%
jan 1, 2003
75.311
+0.052
0.07%
jan 1, 2004
75.812
+0.501
0.67%
jan 1, 2005
76.313
+0.501
0.66%
jan 1, 2006
76.814
+0.501
0.66%
jan 1, 2007
77.315
+0.501
0.65%
jan 1, 2008
77.816
+0.501
0.65%
jan 1, 2009
78.161
+0.345
0.44%
jan 1, 2010
78.507
+0.345
0.44%
jan 1, 2011
78.852
+0.345
0.44%
jan 1, 2012
79.197
+0.345
0.44%
jan 1, 2013
79.543
+0.345
0.44%
jan 1, 2014
79.781
+0.238
0.3%
jan 1, 2015
80.019
+0.238
0.3%
Ranking of countries by current statistics by years


Comments: