29
/
en
AIzaSyAYiBZKx7MnpbEhh9jyipgxe19OcubqV5w
April 1, 2024
196317
Mexico
MEX
true
2
1
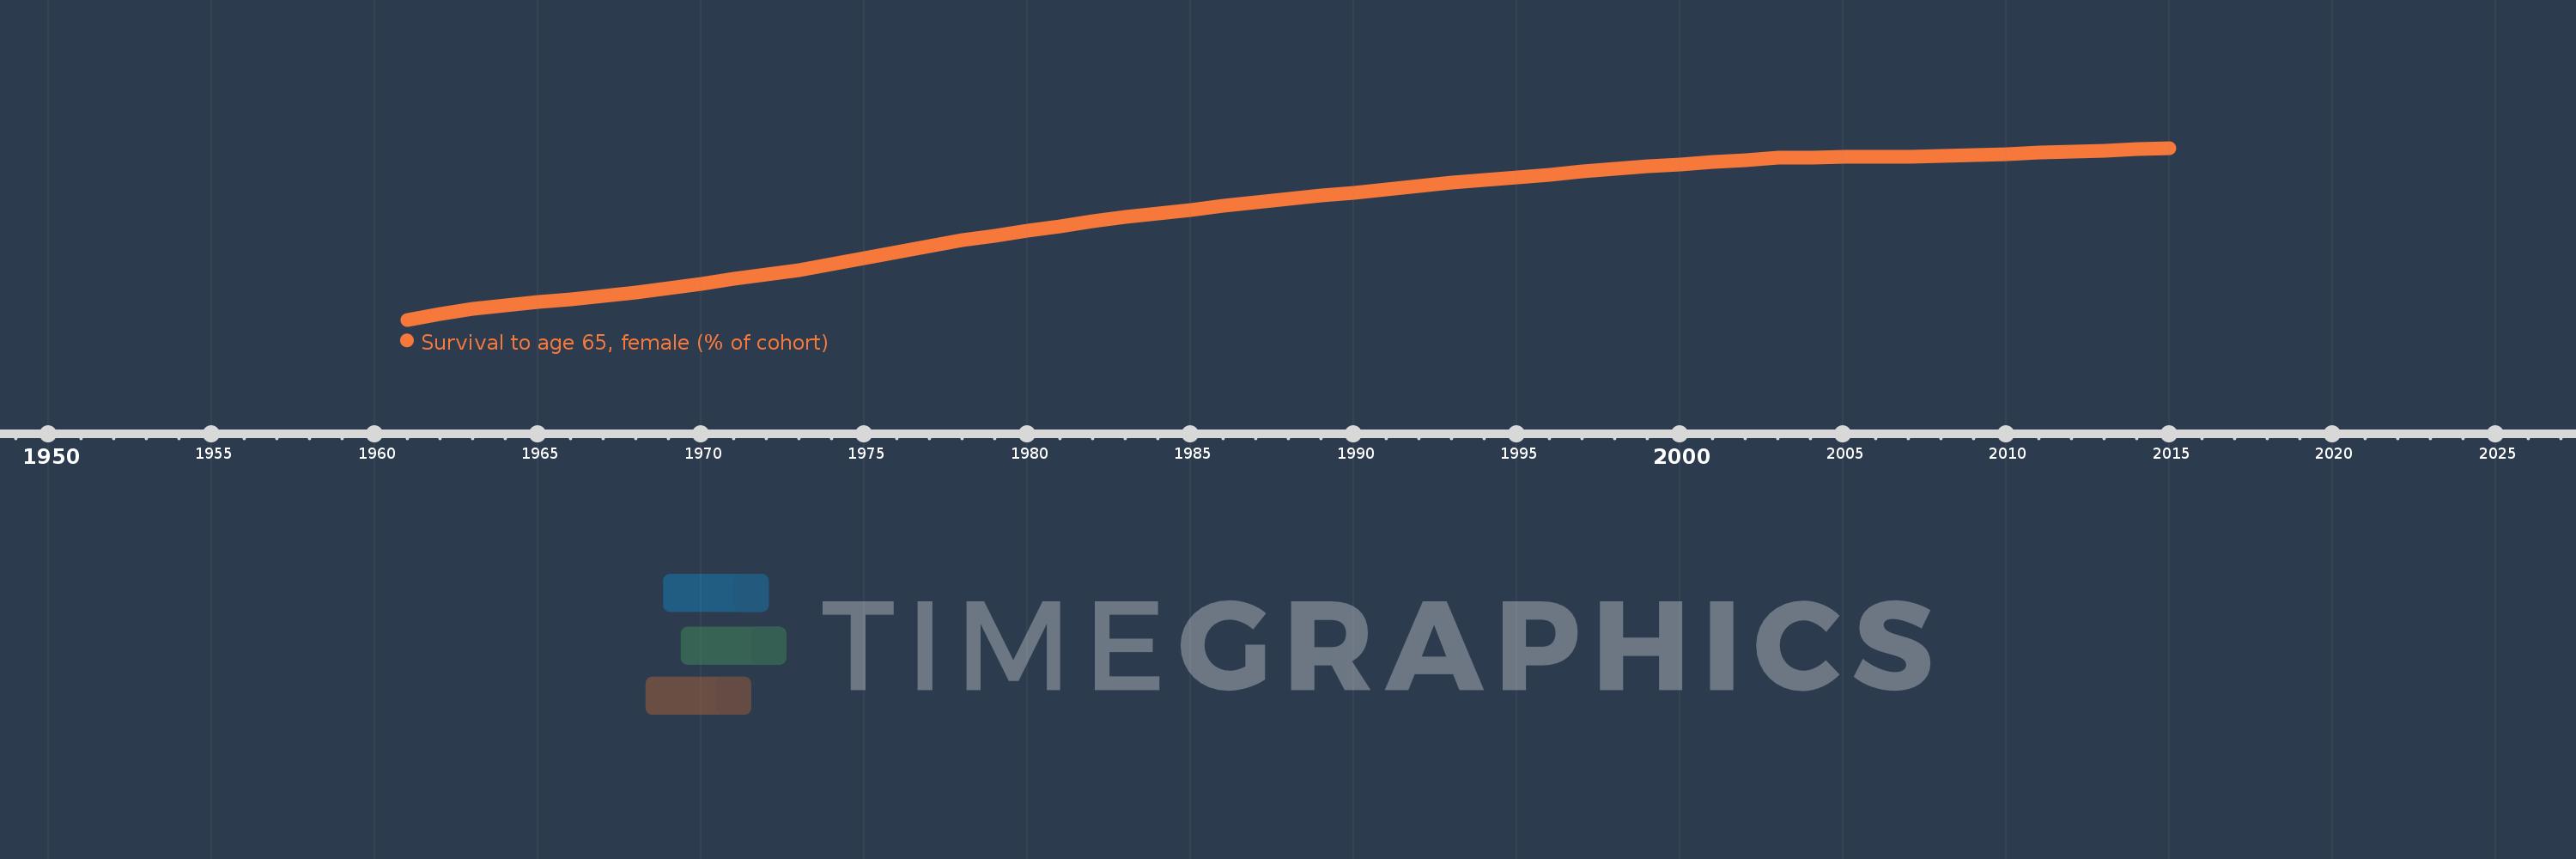
Survival to age 65, female (% of cohort)
2015,2014,2013,2012,2011,2010,2009,2008,2007,2006,2005,2004,2003,2002,2001,2000,1999,1998,1997,1996,1995,1994,1993,1992,1991,1990,1989,1988,1987,1986,1985,1984,1983,1982,1981,1980,1979,1978,1977,1976,1975,1974,1973,1972,1971,1970,1969,1968,1967,1966,1965,1964,1963,1962,1961
This statistics in other country:
AfghanistanAlbaniaAlgeriaAngolaAntigua and BarbudaArab WorldArgentinaArmeniaArubaAustraliaAustriaAzerbaijanBahamas, TheBahrainBangladeshBarbadosBelarusBelgiumBelizeBeninBhutanBoliviaBosnia and HerzegovinaBotswanaBrazilBrunei DarussalamBulgariaBurkina FasoBurundiCabo VerdeCambodiaCameroonCanadaCaribbean small statesCentral African RepublicCentral Europe and the BalticsChadChannel IslandsChileChinaColombiaComorosCongo, Dem. Rep.Congo, Rep.Costa RicaCote d'IvoireCroatiaCubaCuracaoCyprusCzech RepublicDenmarkDjiboutiDominican RepublicEarly-demographic dividendEast Asia & PacificEast Asia & Pacific (excluding high income)East Asia & Pacific (IDA & IBRD countries)EcuadorEgypt, Arab Rep.El SalvadorEquatorial GuineaEritreaEstoniaEthiopiaEuro areaEurope & Central AsiaEurope & Central Asia (excluding high income)Europe & Central Asia (IDA & IBRD countries)European UnionFijiFinlandFragile and conflict affected situationsFranceFrench PolynesiaGabonGambia, TheGeorgiaGermanyGhanaGreeceGrenadaGuamGuatemalaGuineaGuinea-BissauGuyanaHaitiHeavily indebted poor countries (HIPC)High incomeHondurasHong Kong SAR, ChinaHungaryIBRD onlyIcelandIDA & IBRD totalIDA blendIDA onlyIDA totalIndiaIndonesiaIran, Islamic Rep.IraqIrelandIsraelItalyJamaicaJapanJordanKazakhstanKenyaKiribatiKorea, Dem. People’s Rep.Korea, Rep.KuwaitKyrgyz RepublicLao PDRLate-demographic dividendLatin America & Caribbean Latin America & Caribbean (excluding high income)Latin America & the Caribbean (IDA & IBRD countries)LatviaLeast developed countries: UN classificationLebanonLesothoLiberiaLibyaLithuaniaLow & middle incomeLow incomeLower middle incomeLuxembourgMacao SAR, ChinaMacedonia, FYRMadagascarMalawiMalaysiaMaldivesMaliMaltaMauritaniaMauritiusMexicoMicronesia, Fed. Sts.Middle East & North AfricaMiddle East & North Africa (excluding high income)Middle East & North Africa (IDA & IBRD countries)Middle incomeMoldovaMongoliaMontenegroMoroccoMozambiqueMyanmarNamibiaNepalNetherlandsNew CaledoniaNew ZealandNicaraguaNigerNigeriaNorth AmericaNorwayOECD membersOmanOther small statesPacific island small statesPakistanPanamaPapua New GuineaParaguayPeruPhilippinesPolandPortugalPost-demographic dividendPre-demographic dividendPuerto RicoQatarRomaniaRussian FederationRwandaSamoaSao Tome and PrincipeSaudi ArabiaSenegalSerbiaSeychellesSierra LeoneSingaporeSlovak RepublicSloveniaSmall statesSolomon IslandsSomaliaSouth AfricaSouth AsiaSouth Asia (IDA & IBRD)South SudanSpainSri LankaSt. LuciaSt. Vincent and the GrenadinesSub-Saharan Africa Sub-Saharan Africa (excluding high income)Sub-Saharan Africa (IDA & IBRD countries)SudanSurinameSwazilandSwedenSwitzerlandSyrian Arab RepublicTajikistanTanzaniaThailandTimor-LesteTogoTongaTrinidad and TobagoTunisiaTurkeyTurkmenistanUgandaUkraineUnited Arab EmiratesUnited KingdomUnited StatesUpper middle incomeUruguayUzbekistanVanuatuVenezuela, RBVietnamVirgin Islands (U.S.)West Bank and GazaWorldYemen, Rep.ZambiaZimbabwe Timeline:
This timeline shows a graph from 1961 to 2015 of Mexico. No data until 1960. Number of actual observations by date: 55.
Source name:
World Development Indicators
Source organization:
United Nations Population Division. World Population Prospects. New York, United Nations, Department of Economic and Social Affairs (advanced Excel tables). Available at http://esa.un.org/wpp/unpp/panel_population.htm.
Categories, topics:
Health, Gender
Last updated:
apr 23, 2017
Indicators value changes by year
Minimum:
57.404
jan 1, 1961
Maximum:
85.796
jan 1, 2015
At the date of observation
Value
Absolute change
Change from previous value
jan 1, 1961
57.404
+57.404
0.0%
jan 1, 1962
58.309
+0.906
1.58%
jan 1, 1963
59.215
+0.906
1.55%
jan 1, 1964
59.744
+0.529
0.89%
jan 1, 1965
60.273
+0.529
0.89%
jan 1, 1966
60.801
+0.529
0.88%
jan 1, 1967
61.33
+0.529
0.87%
jan 1, 1968
61.859
+0.529
0.86%
jan 1, 1969
62.612
+0.753
1.22%
jan 1, 1970
63.365
+0.753
1.2%
jan 1, 1971
64.119
+0.753
1.19%
jan 1, 1972
64.872
+0.753
1.17%
jan 1, 1973
65.625
+0.753
1.16%
jan 1, 1974
66.601
+0.976
1.49%
jan 1, 1975
67.578
+0.976
1.47%
jan 1, 1976
68.554
+0.976
1.44%
jan 1, 1977
69.531
+0.976
1.42%
jan 1, 1978
70.507
+0.976
1.4%
jan 1, 1979
71.291
+0.784
1.11%
jan 1, 1980
72.074
+0.784
1.1%
jan 1, 1981
72.858
+0.784
1.09%
jan 1, 1982
73.641
+0.784
1.08%
jan 1, 1983
74.425
+0.784
1.06%
jan 1, 1984
75.012
+0.587
0.79%
jan 1, 1985
75.6
+0.587
0.78%
jan 1, 1986
76.187
+0.587
0.78%
jan 1, 1987
76.775
+0.587
0.77%
jan 1, 1988
77.362
+0.587
0.77%
jan 1, 1989
77.891
+0.529
0.68%
jan 1, 1990
78.42
+0.529
0.68%
jan 1, 1991
78.949
+0.529
0.67%
jan 1, 1992
79.478
+0.529
0.67%
jan 1, 1993
80.007
+0.529
0.67%
jan 1, 1994
80.479
+0.472
0.59%
jan 1, 1995
80.951
+0.472
0.59%
jan 1, 1996
81.422
+0.472
0.58%
jan 1, 1997
81.894
+0.472
0.58%
jan 1, 1998
82.366
+0.472
0.58%
jan 1, 1999
82.725
+0.359
0.44%
jan 1, 2000
83.085
+0.359
0.43%
jan 1, 2001
83.444
+0.359
0.43%
jan 1, 2002
83.804
+0.359
0.43%
jan 1, 2003
84.163
+0.359
0.43%
jan 1, 2004
84.22
+0.057
0.07%
jan 1, 2005
84.276
+0.056
0.07%
jan 1, 2006
84.333
+0.057
0.07%
jan 1, 2007
84.389
+0.057
0.07%
jan 1, 2008
84.446
+0.056
0.07%
jan 1, 2009
84.634
+0.188
0.22%
jan 1, 2010
84.822
+0.188
0.22%
jan 1, 2011
85.01
+0.188
0.22%
jan 1, 2012
85.199
+0.188
0.22%
jan 1, 2013
85.387
+0.188
0.22%
jan 1, 2014
85.592
+0.205
0.24%
jan 1, 2015
85.796
+0.205
0.24%
Ranking of countries by current statistics by years


Comments: