29
/
en
AIzaSyAYiBZKx7MnpbEhh9jyipgxe19OcubqV5w
April 1, 2024
80602
Belarus
BLR
true
2
1
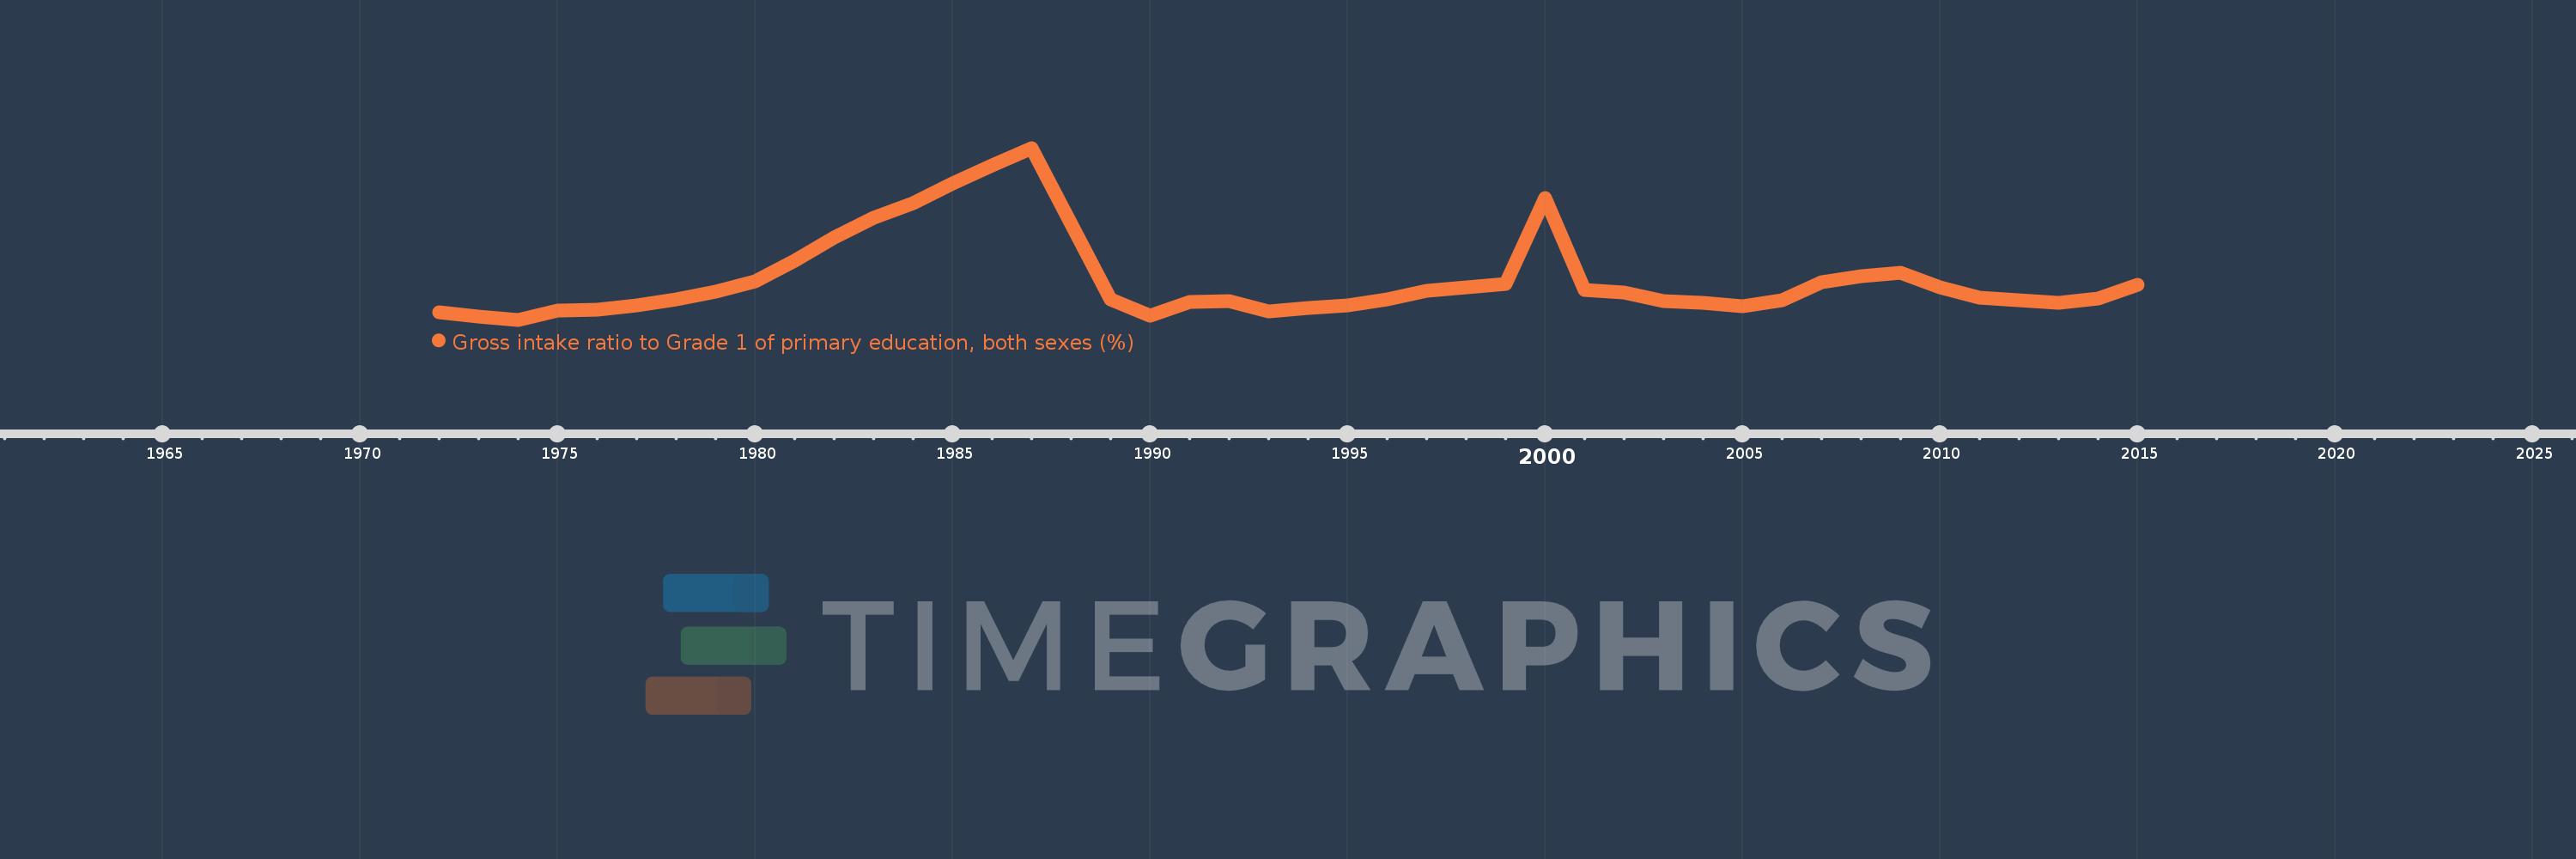
Gross intake ratio to Grade 1 of primary education, both sexes (%)
2015,2014,2013,2012,2011,2010,2009,2008,2007,2006,2005,2004,2003,2002,2001,2000,1999,1998,1997,1996,1995,1994,1993,1992,1991,1990,1989,1987,1986,1985,1984,1983,1982,1981,1980,1979,1978,1977,1976,1975,1974,1973,1972
This statistics in other country:
AfghanistanAlbaniaAlgeriaAngolaAntigua and BarbudaArab WorldArgentinaArmeniaArubaAustriaAzerbaijanBahamas, TheBahrainBangladeshBarbadosBelarusBelgiumBelizeBeninBermudaBhutanBoliviaBosnia and HerzegovinaBotswanaBrazilBritish Virgin IslandsBrunei DarussalamBulgariaBurkina FasoBurundiCabo VerdeCambodiaCameroonCanadaCaribbean small statesCentral African RepublicCentral Europe and the BalticsChadChileChinaColombiaComorosCongo, Dem. Rep.Congo, Rep.Costa RicaCote d'IvoireCroatiaCubaCyprusCzech RepublicDenmarkDjiboutiDominicaDominican RepublicEarly-demographic dividendEast Asia & PacificEast Asia & Pacific (excluding high income)East Asia & Pacific (IDA & IBRD countries)EcuadorEgypt, Arab Rep.El SalvadorEquatorial GuineaEritreaEstoniaEthiopiaEuro areaEurope & Central AsiaEurope & Central Asia (excluding high income)Europe & Central Asia (IDA & IBRD countries)European UnionFijiFinlandFragile and conflict affected situationsFranceGabonGambia, TheGeorgiaGermanyGhanaGreeceGrenadaGuatemalaGuineaGuinea-BissauGuyanaHaitiHeavily indebted poor countries (HIPC)High incomeHondurasHong Kong SAR, ChinaHungaryIBRD onlyIcelandIDA & IBRD totalIDA blendIDA onlyIDA totalIndiaIndonesiaIran, Islamic Rep.IraqIrelandIsraelItalyJamaicaJapanJordanKazakhstanKenyaKiribatiKorea, Dem. People’s Rep.Korea, Rep.KuwaitKyrgyz RepublicLao PDRLate-demographic dividendLatin America & Caribbean Latin America & Caribbean (excluding high income)Latin America & the Caribbean (IDA & IBRD countries)LatviaLeast developed countries: UN classificationLebanonLesothoLiberiaLibyaLiechtensteinLithuaniaLow & middle incomeLow incomeLower middle incomeLuxembourgMacao SAR, ChinaMacedonia, FYRMadagascarMalawiMalaysiaMaldivesMaliMaltaMarshall IslandsMauritaniaMauritiusMexicoMicronesia, Fed. Sts.Middle East & North AfricaMiddle East & North Africa (excluding high income)Middle East & North Africa (IDA & IBRD countries)Middle incomeMoldovaMongoliaMontenegroMoroccoMozambiqueMyanmarNamibiaNauruNepalNetherlandsNew ZealandNicaraguaNigerNigeriaNorth AmericaNorwayOECD membersOmanOther small statesPacific island small statesPakistanPalauPanamaPapua New GuineaParaguayPeruPhilippinesPolandPortugalPost-demographic dividendPre-demographic dividendPuerto RicoQatarRomaniaRussian FederationRwandaSamoaSan MarinoSao Tome and PrincipeSaudi ArabiaSenegalSerbiaSeychellesSierra LeoneSlovak RepublicSloveniaSmall statesSolomon IslandsSouth AfricaSouth AsiaSouth Asia (IDA & IBRD)South SudanSpainSri LankaSt. Kitts and NevisSt. LuciaSt. Vincent and the GrenadinesSub-Saharan Africa Sub-Saharan Africa (excluding high income)Sub-Saharan Africa (IDA & IBRD countries)SudanSurinameSwazilandSwedenSwitzerlandSyrian Arab RepublicTajikistanTanzaniaThailandTimor-LesteTogoTongaTrinidad and TobagoTunisiaTurkeyTuvaluUgandaUkraineUnited Arab EmiratesUnited StatesUpper middle incomeUruguayUzbekistanVanuatuVenezuela, RBVietnamWest Bank and GazaWorldYemen, Rep.ZambiaZimbabwe Timeline:
This timeline shows a graph from 1972 to 2015 of Belarus. No data until 1971. Number of actual observations by date: 43.
Source name:
World Development Indicators
Source organization:
UNESCO Institute for Statistics
Categories, topics:
Education
Last updated:
apr 23, 2017
Indicators value changes by year
Minimum:
91.466
jan 1, 1974
Maximum:
150.631
jan 1, 1987
At the date of observation
Value
Absolute change
Change from previous value
jan 1, 1972
94.107
+94.107
0.0%
jan 1, 1973
92.576
-1.531
-1.63%
jan 1, 1974
91.466
-1.11
-1.2%
jan 1, 1975
94.567
+3.101
3.39%
jan 1, 1976
94.801
+0.234
0.25%
jan 1, 1977
96.263
+1.462
1.54%
jan 1, 1978
98.497
+2.234
2.32%
jan 1, 1979
101.096
+2.599
2.64%
jan 1, 1980
104.584
+3.487
3.45%
jan 1, 1981
111.778
+7.195
6.88%
jan 1, 1982
119.863
+8.084
7.23%
jan 1, 1983
126.578
+6.715
5.6%
jan 1, 1984
131.473
+4.895
3.87%
jan 1, 1985
138.422
+6.95
5.29%
jan 1, 1986
144.628
+6.205
4.48%
jan 1, 1987
150.631
+6.003
4.15%
jan 1, 1989
98.351
-52.28
-34.71%
jan 1, 1990
92.734
-5.617
-5.71%
jan 1, 1991
97.53
+4.795
5.17%
jan 1, 1992
97.968
+0.439
0.45%
jan 1, 1993
94.279
-3.689
-3.77%
jan 1, 1994
95.404
+1.125
1.19%
jan 1, 1995
96.543
+1.139
1.19%
jan 1, 1996
98.358
+1.815
1.88%
jan 1, 1997
101.47
+3.112
3.16%
jan 1, 1998
102.712
+1.242
1.22%
jan 1, 1999
103.748
+1.036
1.01%
jan 1, 2000
133.444
+29.696
28.62%
jan 1, 2001
101.849
-31.595
-23.68%
jan 1, 2002
100.893
-0.957
-0.94%
jan 1, 2003
97.989
-2.904
-2.88%
jan 1, 2004
97.3
-0.689
-0.7%
jan 1, 2005
96.209
-1.091
-1.12%
jan 1, 2006
98.087
+1.878
1.95%
jan 1, 2007
104.353
+6.267
6.39%
jan 1, 2008
106.317
+1.964
1.88%
jan 1, 2009
107.754
+1.437
1.35%
jan 1, 2010
102.712
-5.042
-4.68%
jan 1, 2011
98.999
-3.713
-3.61%
jan 1, 2012
98.158
-0.841
-0.85%
jan 1, 2013
97.308
-0.85
-0.87%
jan 1, 2014
98.824
+1.517
1.56%
jan 1, 2015
103.429
+4.605
4.66%
Ranking of countries by current statistics by years


Comments: