29
/
en
AIzaSyAYiBZKx7MnpbEhh9jyipgxe19OcubqV5w
April 1, 2024
214374
Norway
NOR
true
2
1
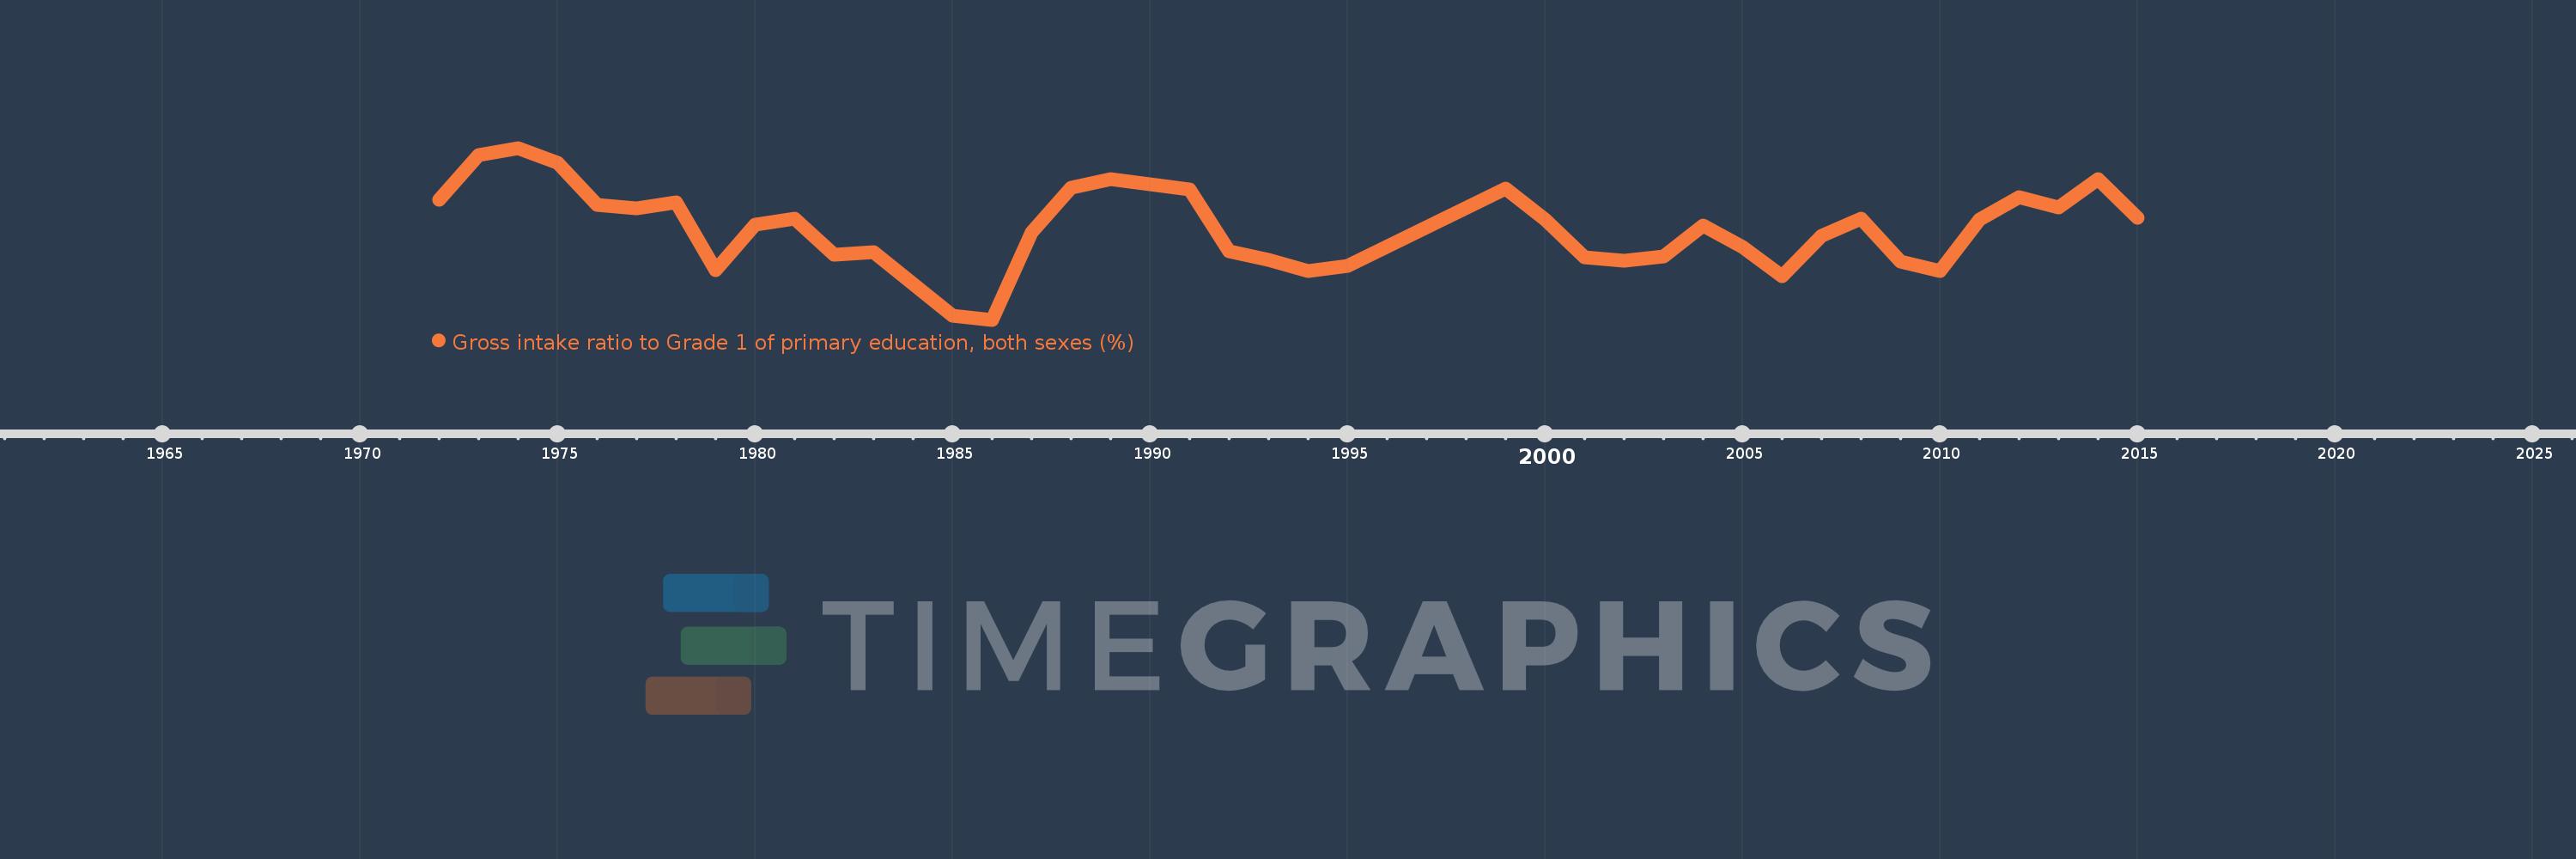
Gross intake ratio to Grade 1 of primary education, both sexes (%)
2015,2014,2013,2012,2011,2010,2009,2008,2007,2006,2005,2004,2003,2002,2001,2000,1999,1995,1994,1993,1992,1991,1990,1989,1988,1987,1986,1985,1983,1982,1981,1980,1979,1978,1977,1976,1975,1974,1973,1972
This statistics in other country:
AfghanistanAlbaniaAlgeriaAngolaAntigua and BarbudaArab WorldArgentinaArmeniaArubaAustriaAzerbaijanBahamas, TheBahrainBangladeshBarbadosBelarusBelgiumBelizeBeninBermudaBhutanBoliviaBosnia and HerzegovinaBotswanaBrazilBritish Virgin IslandsBrunei DarussalamBulgariaBurkina FasoBurundiCabo VerdeCambodiaCameroonCanadaCaribbean small statesCentral African RepublicCentral Europe and the BalticsChadChileChinaColombiaComorosCongo, Dem. Rep.Congo, Rep.Costa RicaCote d'IvoireCroatiaCubaCyprusCzech RepublicDenmarkDjiboutiDominicaDominican RepublicEarly-demographic dividendEast Asia & PacificEast Asia & Pacific (excluding high income)East Asia & Pacific (IDA & IBRD countries)EcuadorEgypt, Arab Rep.El SalvadorEquatorial GuineaEritreaEstoniaEthiopiaEuro areaEurope & Central AsiaEurope & Central Asia (excluding high income)Europe & Central Asia (IDA & IBRD countries)European UnionFijiFinlandFragile and conflict affected situationsFranceGabonGambia, TheGeorgiaGermanyGhanaGreeceGrenadaGuatemalaGuineaGuinea-BissauGuyanaHaitiHeavily indebted poor countries (HIPC)High incomeHondurasHong Kong SAR, ChinaHungaryIBRD onlyIcelandIDA & IBRD totalIDA blendIDA onlyIDA totalIndiaIndonesiaIran, Islamic Rep.IraqIrelandIsraelItalyJamaicaJapanJordanKazakhstanKenyaKiribatiKorea, Dem. People’s Rep.Korea, Rep.KuwaitKyrgyz RepublicLao PDRLate-demographic dividendLatin America & Caribbean Latin America & Caribbean (excluding high income)Latin America & the Caribbean (IDA & IBRD countries)LatviaLeast developed countries: UN classificationLebanonLesothoLiberiaLibyaLiechtensteinLithuaniaLow & middle incomeLow incomeLower middle incomeLuxembourgMacao SAR, ChinaMacedonia, FYRMadagascarMalawiMalaysiaMaldivesMaliMaltaMarshall IslandsMauritaniaMauritiusMexicoMicronesia, Fed. Sts.Middle East & North AfricaMiddle East & North Africa (excluding high income)Middle East & North Africa (IDA & IBRD countries)Middle incomeMoldovaMongoliaMontenegroMoroccoMozambiqueMyanmarNamibiaNauruNepalNetherlandsNew ZealandNicaraguaNigerNigeriaNorth AmericaNorwayOECD membersOmanOther small statesPacific island small statesPakistanPalauPanamaPapua New GuineaParaguayPeruPhilippinesPolandPortugalPost-demographic dividendPre-demographic dividendPuerto RicoQatarRomaniaRussian FederationRwandaSamoaSan MarinoSao Tome and PrincipeSaudi ArabiaSenegalSerbiaSeychellesSierra LeoneSlovak RepublicSloveniaSmall statesSolomon IslandsSouth AfricaSouth AsiaSouth Asia (IDA & IBRD)South SudanSpainSri LankaSt. Kitts and NevisSt. LuciaSt. Vincent and the GrenadinesSub-Saharan Africa Sub-Saharan Africa (excluding high income)Sub-Saharan Africa (IDA & IBRD countries)SudanSurinameSwazilandSwedenSwitzerlandSyrian Arab RepublicTajikistanTanzaniaThailandTimor-LesteTogoTongaTrinidad and TobagoTunisiaTurkeyTuvaluUgandaUkraineUnited Arab EmiratesUnited StatesUpper middle incomeUruguayUzbekistanVanuatuVenezuela, RBVietnamWest Bank and GazaWorldYemen, Rep.ZambiaZimbabwe Timeline:
This timeline shows a graph from 1972 to 2015 of Norway. No data until 1971. Number of actual observations by date: 40.
Source name:
World Development Indicators
Source organization:
UNESCO Institute for Statistics
Categories, topics:
Education
Last updated:
apr 23, 2017
Indicators value changes by year
Minimum:
94.356
jan 1, 1986
Maximum:
104.442
jan 1, 1974
At the date of observation
Value
Absolute change
Change from previous value
jan 1, 1972
101.414
+101.414
0.0%
jan 1, 1973
104.047
+2.633
2.6%
jan 1, 1974
104.442
+0.395
0.38%
jan 1, 1975
103.546
-0.896
-0.86%
jan 1, 1976
101.104
-2.442
-2.36%
jan 1, 1977
100.898
-0.206
-0.2%
jan 1, 1978
101.248
+0.35
0.35%
jan 1, 1979
97.28
-3.968
-3.92%
jan 1, 1980
99.962
+2.682
2.76%
jan 1, 1981
100.309
+0.347
0.35%
jan 1, 1982
98.197
-2.112
-2.11%
jan 1, 1983
98.336
+0.139
0.14%
jan 1, 1985
94.585
-3.751
-3.81%
jan 1, 1986
94.356
-0.229
-0.24%
jan 1, 1987
99.507
+5.151
5.46%
jan 1, 1988
102.1
+2.593
2.61%
jan 1, 1989
102.602
+0.503
0.49%
jan 1, 1990
102.332
-0.27
-0.26%
jan 1, 1991
101.989
-0.343
-0.34%
jan 1, 1992
98.399
-3.59
-3.52%
jan 1, 1993
97.889
-0.51
-0.52%
jan 1, 1994
97.23
-0.659
-0.67%
jan 1, 1995
97.536
+0.306
0.31%
jan 1, 1999
102.076
+4.54
4.66%
jan 1, 2000
100.247
-1.829
-1.79%
jan 1, 2001
98.004
-2.243
-2.24%
jan 1, 2002
97.845
-0.159
-0.16%
jan 1, 2003
98.075
+0.23
0.23%
jan 1, 2004
99.9
+1.826
1.86%
jan 1, 2005
98.651
-1.25
-1.25%
jan 1, 2006
96.929
-1.722
-1.75%
jan 1, 2007
99.302
+2.373
2.45%
jan 1, 2008
100.304
+1.002
1.01%
jan 1, 2009
97.775
-2.529
-2.52%
jan 1, 2010
97.198
-0.577
-0.59%
jan 1, 2011
100.246
+3.048
3.14%
jan 1, 2012
101.539
+1.293
1.29%
jan 1, 2013
100.924
-0.615
-0.61%
jan 1, 2014
102.592
+1.668
1.65%
jan 1, 2015
100.367
-2.225
-2.17%
Ranking of countries by current statistics by years


Comments: