29
/
en
AIzaSyAYiBZKx7MnpbEhh9jyipgxe19OcubqV5w
April 1, 2024
256400
Sweden
SWE
true
2
1
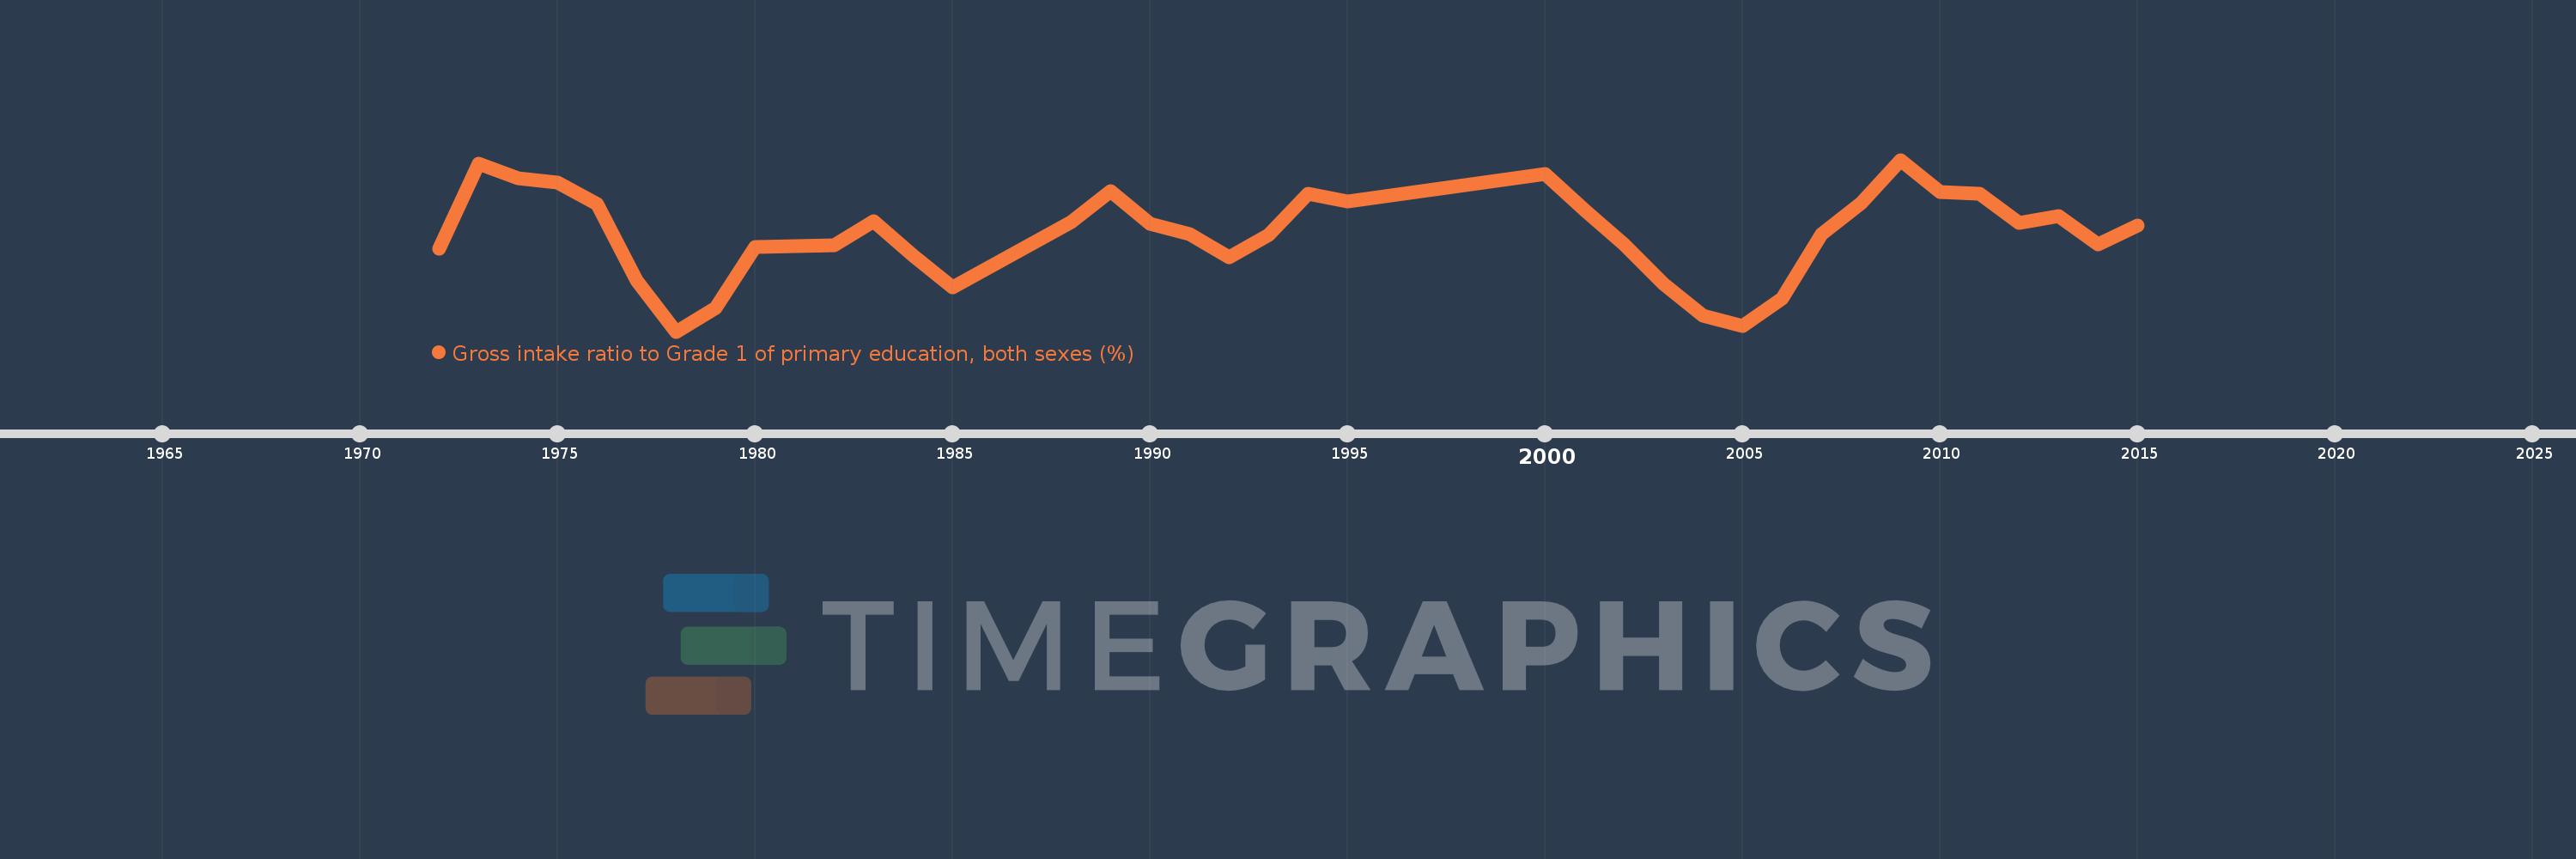
Gross intake ratio to Grade 1 of primary education, both sexes (%)
2015,2014,2013,2012,2011,2010,2009,2008,2007,2006,2005,2004,2003,2002,2001,2000,1995,1994,1993,1992,1991,1990,1989,1988,1985,1984,1983,1982,1981,1980,1979,1978,1977,1976,1975,1974,1973,1972
This statistics in other country:
AfghanistanAlbaniaAlgeriaAngolaAntigua and BarbudaArab WorldArgentinaArmeniaArubaAustriaAzerbaijanBahamas, TheBahrainBangladeshBarbadosBelarusBelgiumBelizeBeninBermudaBhutanBoliviaBosnia and HerzegovinaBotswanaBrazilBritish Virgin IslandsBrunei DarussalamBulgariaBurkina FasoBurundiCabo VerdeCambodiaCameroonCanadaCaribbean small statesCentral African RepublicCentral Europe and the BalticsChadChileChinaColombiaComorosCongo, Dem. Rep.Congo, Rep.Costa RicaCote d'IvoireCroatiaCubaCyprusCzech RepublicDenmarkDjiboutiDominicaDominican RepublicEarly-demographic dividendEast Asia & PacificEast Asia & Pacific (excluding high income)East Asia & Pacific (IDA & IBRD countries)EcuadorEgypt, Arab Rep.El SalvadorEquatorial GuineaEritreaEstoniaEthiopiaEuro areaEurope & Central AsiaEurope & Central Asia (excluding high income)Europe & Central Asia (IDA & IBRD countries)European UnionFijiFinlandFragile and conflict affected situationsFranceGabonGambia, TheGeorgiaGermanyGhanaGreeceGrenadaGuatemalaGuineaGuinea-BissauGuyanaHaitiHeavily indebted poor countries (HIPC)High incomeHondurasHong Kong SAR, ChinaHungaryIBRD onlyIcelandIDA & IBRD totalIDA blendIDA onlyIDA totalIndiaIndonesiaIran, Islamic Rep.IraqIrelandIsraelItalyJamaicaJapanJordanKazakhstanKenyaKiribatiKorea, Dem. People’s Rep.Korea, Rep.KuwaitKyrgyz RepublicLao PDRLate-demographic dividendLatin America & Caribbean Latin America & Caribbean (excluding high income)Latin America & the Caribbean (IDA & IBRD countries)LatviaLeast developed countries: UN classificationLebanonLesothoLiberiaLibyaLiechtensteinLithuaniaLow & middle incomeLow incomeLower middle incomeLuxembourgMacao SAR, ChinaMacedonia, FYRMadagascarMalawiMalaysiaMaldivesMaliMaltaMarshall IslandsMauritaniaMauritiusMexicoMicronesia, Fed. Sts.Middle East & North AfricaMiddle East & North Africa (excluding high income)Middle East & North Africa (IDA & IBRD countries)Middle incomeMoldovaMongoliaMontenegroMoroccoMozambiqueMyanmarNamibiaNauruNepalNetherlandsNew ZealandNicaraguaNigerNigeriaNorth AmericaNorwayOECD membersOmanOther small statesPacific island small statesPakistanPalauPanamaPapua New GuineaParaguayPeruPhilippinesPolandPortugalPost-demographic dividendPre-demographic dividendPuerto RicoQatarRomaniaRussian FederationRwandaSamoaSan MarinoSao Tome and PrincipeSaudi ArabiaSenegalSerbiaSeychellesSierra LeoneSlovak RepublicSloveniaSmall statesSolomon IslandsSouth AfricaSouth AsiaSouth Asia (IDA & IBRD)South SudanSpainSri LankaSt. Kitts and NevisSt. LuciaSt. Vincent and the GrenadinesSub-Saharan Africa Sub-Saharan Africa (excluding high income)Sub-Saharan Africa (IDA & IBRD countries)SudanSurinameSwazilandSwedenSwitzerlandSyrian Arab RepublicTajikistanTanzaniaThailandTimor-LesteTogoTongaTrinidad and TobagoTunisiaTurkeyTuvaluUgandaUkraineUnited Arab EmiratesUnited StatesUpper middle incomeUruguayUzbekistanVanuatuVenezuela, RBVietnamWest Bank and GazaWorldYemen, Rep.ZambiaZimbabwe Timeline:
This timeline shows a graph from 1972 to 2015 of Sweden. No data until 1971. Number of actual observations by date: 38.
Source name:
World Development Indicators
Source organization:
UNESCO Institute for Statistics
Categories, topics:
Education
Last updated:
apr 23, 2017
Indicators value changes by year
Minimum:
92.137
jan 1, 1978
Maximum:
106.415
jan 1, 2009
At the date of observation
Value
Absolute change
Change from previous value
jan 1, 1972
99.021
+99.021
0.0%
jan 1, 1973
106.107
+7.086
7.16%
jan 1, 1974
104.895
-1.212
-1.14%
jan 1, 1975
104.525
-0.37
-0.35%
jan 1, 1976
102.739
-1.786
-1.71%
jan 1, 1977
96.407
-6.332
-6.16%
jan 1, 1978
92.137
-4.27
-4.43%
jan 1, 1979
94.115
+1.978
2.15%
jan 1, 1980
99.185
+5.07
5.39%
jan 1, 1981
99.226
+0.041
0.04%
jan 1, 1982
99.339
+0.114
0.11%
jan 1, 1983
101.279
+1.94
1.95%
jan 1, 1984
98.456
-2.823
-2.79%
jan 1, 1985
95.849
-2.607
-2.65%
jan 1, 1988
101.224
+5.375
5.61%
jan 1, 1989
103.788
+2.564
2.53%
jan 1, 1990
101.11
-2.678
-2.58%
jan 1, 1991
100.226
-0.884
-0.87%
jan 1, 1992
98.312
-1.914
-1.91%
jan 1, 1993
100.191
+1.879
1.91%
jan 1, 1994
103.568
+3.377
3.37%
jan 1, 1995
102.962
-0.607
-0.59%
jan 1, 2000
105.224
+2.262
2.2%
jan 1, 2001
102.273
-2.952
-2.8%
jan 1, 2002
99.397
-2.875
-2.81%
jan 1, 2003
96.067
-3.33
-3.35%
jan 1, 2004
93.48
-2.588
-2.69%
jan 1, 2005
92.599
-0.881
-0.94%
jan 1, 2006
94.865
+2.266
2.45%
jan 1, 2007
100.228
+5.363
5.65%
jan 1, 2008
102.841
+2.612
2.61%
jan 1, 2009
106.415
+3.574
3.48%
jan 1, 2010
103.72
-2.695
-2.53%
jan 1, 2011
103.569
-0.151
-0.15%
jan 1, 2012
101.157
-2.411
-2.33%
jan 1, 2013
101.717
+0.559
0.55%
jan 1, 2014
99.415
-2.302
-2.26%
jan 1, 2015
100.973
+1.558
1.57%
Ranking of countries by current statistics by years


Comments: