29
/
en
AIzaSyAYiBZKx7MnpbEhh9jyipgxe19OcubqV5w
April 1, 2024
126245
El Salvador
SLV
true
2
1
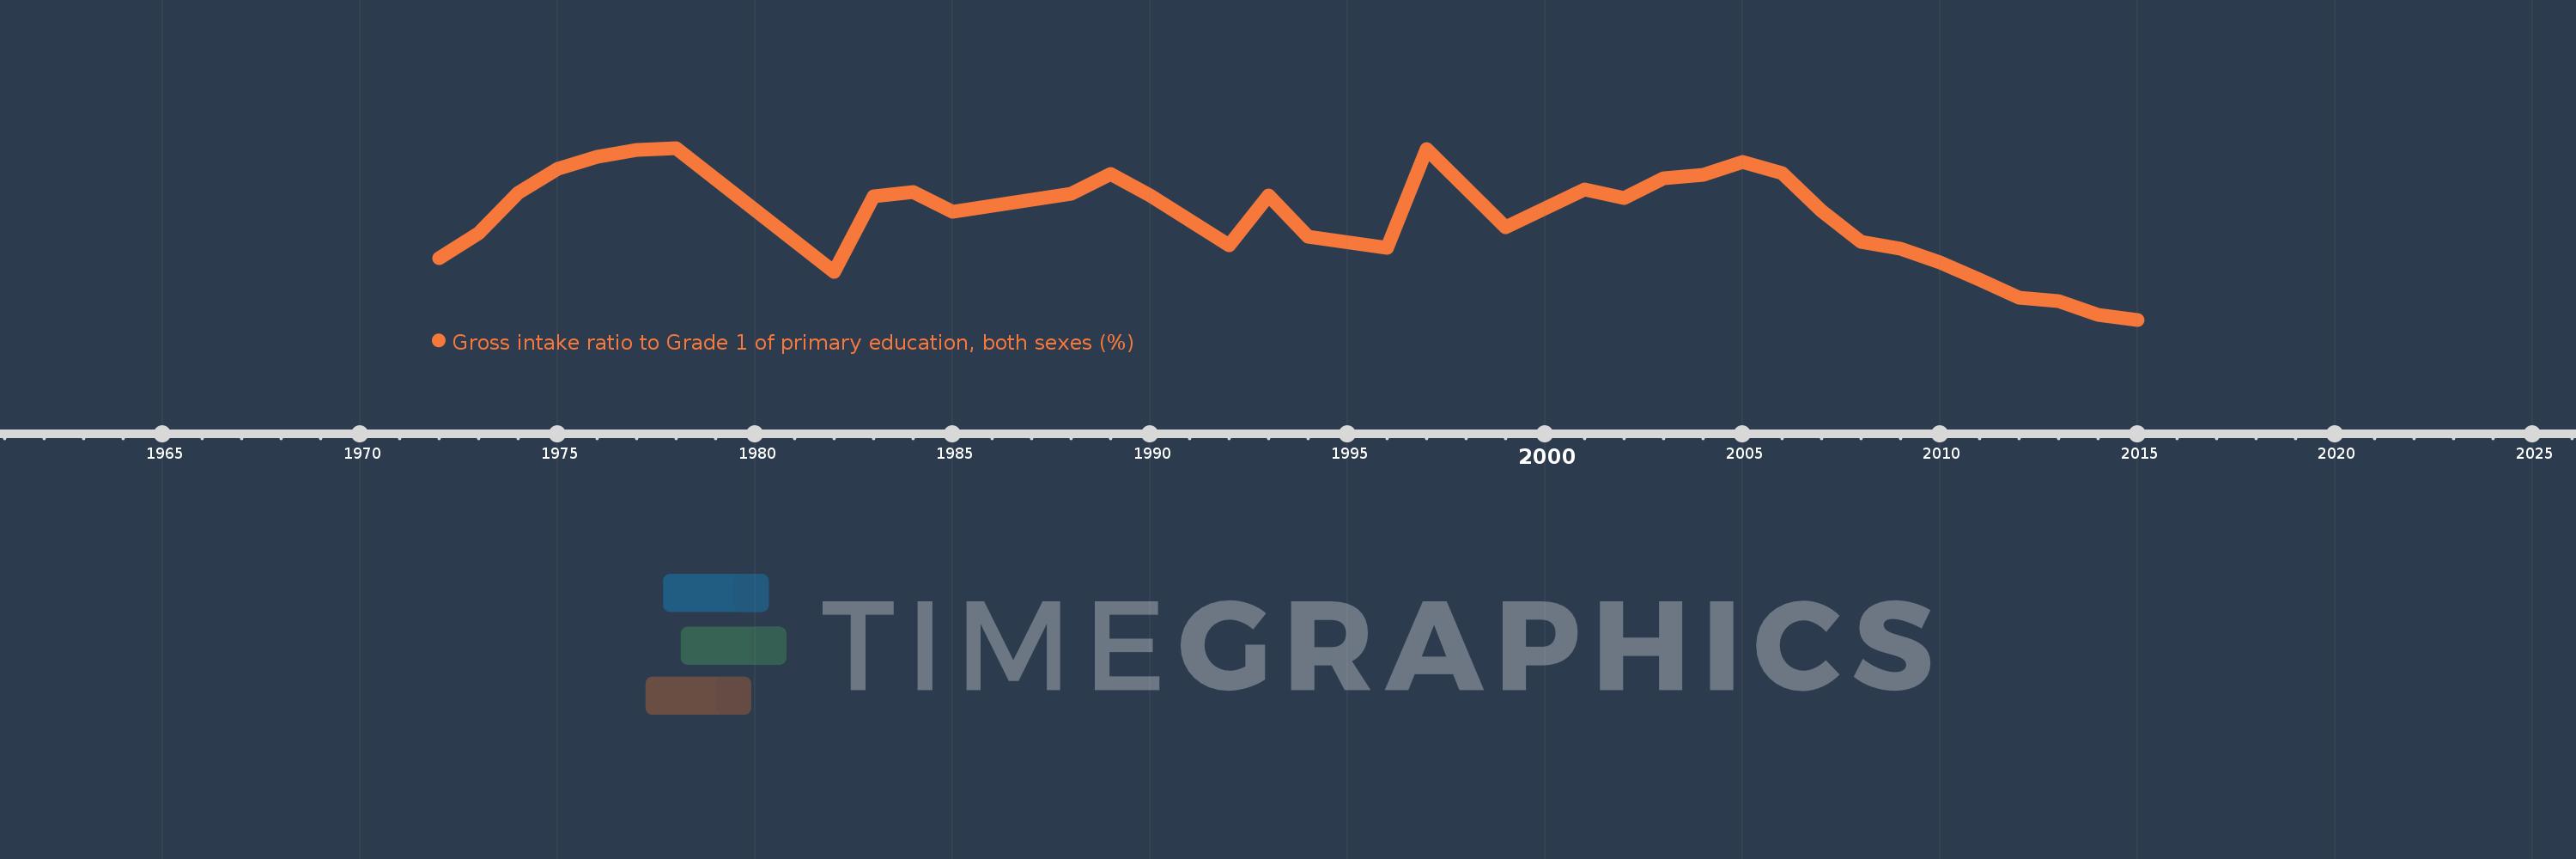
Gross intake ratio to Grade 1 of primary education, both sexes (%)
2015,2014,2013,2012,2011,2010,2009,2008,2007,2006,2005,2004,2003,2002,2001,2000,1999,1997,1996,1994,1993,1992,1990,1989,1988,1985,1984,1983,1982,1978,1977,1976,1975,1974,1973,1972
This statistics in other country:
AfghanistanAlbaniaAlgeriaAngolaAntigua and BarbudaArab WorldArgentinaArmeniaArubaAustriaAzerbaijanBahamas, TheBahrainBangladeshBarbadosBelarusBelgiumBelizeBeninBermudaBhutanBoliviaBosnia and HerzegovinaBotswanaBrazilBritish Virgin IslandsBrunei DarussalamBulgariaBurkina FasoBurundiCabo VerdeCambodiaCameroonCanadaCaribbean small statesCentral African RepublicCentral Europe and the BalticsChadChileChinaColombiaComorosCongo, Dem. Rep.Congo, Rep.Costa RicaCote d'IvoireCroatiaCubaCyprusCzech RepublicDenmarkDjiboutiDominicaDominican RepublicEarly-demographic dividendEast Asia & PacificEast Asia & Pacific (excluding high income)East Asia & Pacific (IDA & IBRD countries)EcuadorEgypt, Arab Rep.El SalvadorEquatorial GuineaEritreaEstoniaEthiopiaEuro areaEurope & Central AsiaEurope & Central Asia (excluding high income)Europe & Central Asia (IDA & IBRD countries)European UnionFijiFinlandFragile and conflict affected situationsFranceGabonGambia, TheGeorgiaGermanyGhanaGreeceGrenadaGuatemalaGuineaGuinea-BissauGuyanaHaitiHeavily indebted poor countries (HIPC)High incomeHondurasHong Kong SAR, ChinaHungaryIBRD onlyIcelandIDA & IBRD totalIDA blendIDA onlyIDA totalIndiaIndonesiaIran, Islamic Rep.IraqIrelandIsraelItalyJamaicaJapanJordanKazakhstanKenyaKiribatiKorea, Dem. People’s Rep.Korea, Rep.KuwaitKyrgyz RepublicLao PDRLate-demographic dividendLatin America & Caribbean Latin America & Caribbean (excluding high income)Latin America & the Caribbean (IDA & IBRD countries)LatviaLeast developed countries: UN classificationLebanonLesothoLiberiaLibyaLiechtensteinLithuaniaLow & middle incomeLow incomeLower middle incomeLuxembourgMacao SAR, ChinaMacedonia, FYRMadagascarMalawiMalaysiaMaldivesMaliMaltaMarshall IslandsMauritaniaMauritiusMexicoMicronesia, Fed. Sts.Middle East & North AfricaMiddle East & North Africa (excluding high income)Middle East & North Africa (IDA & IBRD countries)Middle incomeMoldovaMongoliaMontenegroMoroccoMozambiqueMyanmarNamibiaNauruNepalNetherlandsNew ZealandNicaraguaNigerNigeriaNorth AmericaNorwayOECD membersOmanOther small statesPacific island small statesPakistanPalauPanamaPapua New GuineaParaguayPeruPhilippinesPolandPortugalPost-demographic dividendPre-demographic dividendPuerto RicoQatarRomaniaRussian FederationRwandaSamoaSan MarinoSao Tome and PrincipeSaudi ArabiaSenegalSerbiaSeychellesSierra LeoneSlovak RepublicSloveniaSmall statesSolomon IslandsSouth AfricaSouth AsiaSouth Asia (IDA & IBRD)South SudanSpainSri LankaSt. Kitts and NevisSt. LuciaSt. Vincent and the GrenadinesSub-Saharan Africa Sub-Saharan Africa (excluding high income)Sub-Saharan Africa (IDA & IBRD countries)SudanSurinameSwazilandSwedenSwitzerlandSyrian Arab RepublicTajikistanTanzaniaThailandTimor-LesteTogoTongaTrinidad and TobagoTunisiaTurkeyTuvaluUgandaUkraineUnited Arab EmiratesUnited StatesUpper middle incomeUruguayUzbekistanVanuatuVenezuela, RBVietnamWest Bank and GazaWorldYemen, Rep.ZambiaZimbabwe Timeline:
This timeline shows a graph from 1972 to 2015 of El Salvador. No data until 1971. Number of actual observations by date: 36.
Source name:
World Development Indicators
Source organization:
UNESCO Institute for Statistics
Categories, topics:
Education
Last updated:
apr 23, 2017
Indicators value changes by year
Minimum:
106.467
jan 1, 2015
Maximum:
148.84
jan 1, 1978
At the date of observation
Value
Absolute change
Change from previous value
jan 1, 1972
121.749
+121.749
0.0%
jan 1, 1973
127.89
+6.141
5.04%
jan 1, 1974
137.864
+9.974
7.8%
jan 1, 1975
143.774
+5.91
4.29%
jan 1, 1976
146.75
+2.975
2.07%
jan 1, 1977
148.442
+1.693
1.15%
jan 1, 1978
148.84
+0.398
0.27%
jan 1, 1982
118.228
-30.612
-20.57%
jan 1, 1983
136.847
+18.619
15.75%
jan 1, 1984
137.983
+1.136
0.83%
jan 1, 1985
133.006
-4.977
-3.61%
jan 1, 1988
137.445
+4.439
3.34%
jan 1, 1989
142.392
+4.948
3.6%
jan 1, 1990
137.073
-5.319
-3.74%
jan 1, 1992
124.883
-12.191
-8.89%
jan 1, 1993
137.104
+12.221
9.79%
jan 1, 1994
126.915
-10.189
-7.43%
jan 1, 1996
124.251
-2.664
-2.1%
jan 1, 1997
148.477
+24.226
19.5%
jan 1, 1999
129.354
-19.123
-12.88%
jan 1, 2000
133.872
+4.517
3.49%
jan 1, 2001
138.541
+4.67
3.49%
jan 1, 2002
136.569
-1.972
-1.42%
jan 1, 2003
141.393
+4.824
3.53%
jan 1, 2004
142.125
+0.732
0.52%
jan 1, 2005
145.457
+3.332
2.34%
jan 1, 2006
142.546
-2.911
-2.0%
jan 1, 2007
133.318
-9.228
-6.47%
jan 1, 2008
125.744
-7.575
-5.68%
jan 1, 2009
123.965
-1.779
-1.41%
jan 1, 2010
120.512
-3.453
-2.79%
jan 1, 2011
116.257
-4.256
-3.53%
jan 1, 2012
111.871
-4.385
-3.77%
jan 1, 2013
111.002
-0.87
-0.78%
jan 1, 2014
107.604
-3.398
-3.06%
jan 1, 2015
106.467
-1.136
-1.06%
Ranking of countries by current statistics by years


Comments: