29
/
en
AIzaSyAYiBZKx7MnpbEhh9jyipgxe19OcubqV5w
April 1, 2024
115853
Cuba
CUB
true
2
1
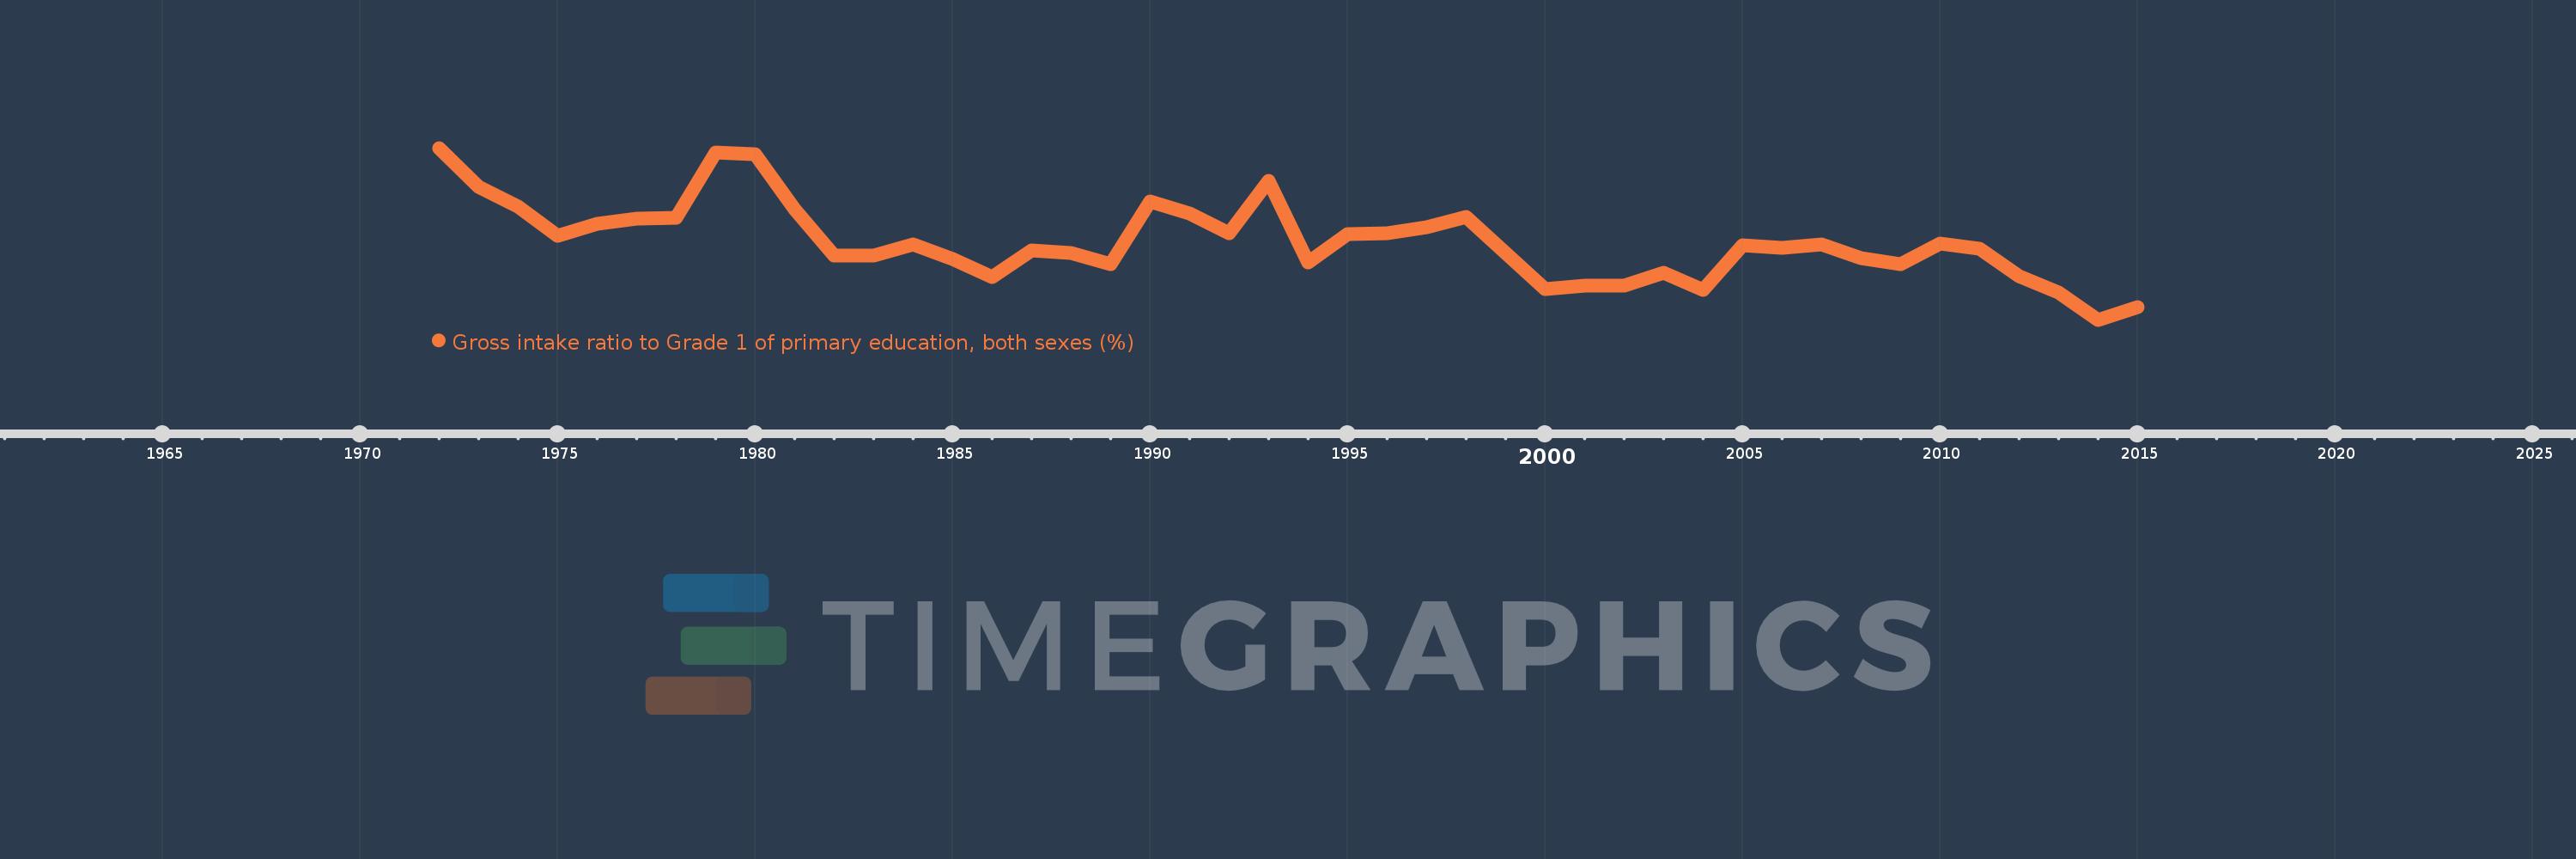
Gross intake ratio to Grade 1 of primary education, both sexes (%)
2015,2014,2013,2012,2011,2010,2009,2008,2007,2006,2005,2004,2003,2002,2001,2000,1998,1997,1996,1995,1994,1993,1992,1991,1990,1989,1988,1987,1986,1985,1984,1983,1982,1981,1980,1979,1978,1977,1976,1975,1974,1973,1972
This statistics in other country:
AfghanistanAlbaniaAlgeriaAngolaAntigua and BarbudaArab WorldArgentinaArmeniaArubaAustriaAzerbaijanBahamas, TheBahrainBangladeshBarbadosBelarusBelgiumBelizeBeninBermudaBhutanBoliviaBosnia and HerzegovinaBotswanaBrazilBritish Virgin IslandsBrunei DarussalamBulgariaBurkina FasoBurundiCabo VerdeCambodiaCameroonCanadaCaribbean small statesCentral African RepublicCentral Europe and the BalticsChadChileChinaColombiaComorosCongo, Dem. Rep.Congo, Rep.Costa RicaCote d'IvoireCroatiaCubaCyprusCzech RepublicDenmarkDjiboutiDominicaDominican RepublicEarly-demographic dividendEast Asia & PacificEast Asia & Pacific (excluding high income)East Asia & Pacific (IDA & IBRD countries)EcuadorEgypt, Arab Rep.El SalvadorEquatorial GuineaEritreaEstoniaEthiopiaEuro areaEurope & Central AsiaEurope & Central Asia (excluding high income)Europe & Central Asia (IDA & IBRD countries)European UnionFijiFinlandFragile and conflict affected situationsFranceGabonGambia, TheGeorgiaGermanyGhanaGreeceGrenadaGuatemalaGuineaGuinea-BissauGuyanaHaitiHeavily indebted poor countries (HIPC)High incomeHondurasHong Kong SAR, ChinaHungaryIBRD onlyIcelandIDA & IBRD totalIDA blendIDA onlyIDA totalIndiaIndonesiaIran, Islamic Rep.IraqIrelandIsraelItalyJamaicaJapanJordanKazakhstanKenyaKiribatiKorea, Dem. People’s Rep.Korea, Rep.KuwaitKyrgyz RepublicLao PDRLate-demographic dividendLatin America & Caribbean Latin America & Caribbean (excluding high income)Latin America & the Caribbean (IDA & IBRD countries)LatviaLeast developed countries: UN classificationLebanonLesothoLiberiaLibyaLiechtensteinLithuaniaLow & middle incomeLow incomeLower middle incomeLuxembourgMacao SAR, ChinaMacedonia, FYRMadagascarMalawiMalaysiaMaldivesMaliMaltaMarshall IslandsMauritaniaMauritiusMexicoMicronesia, Fed. Sts.Middle East & North AfricaMiddle East & North Africa (excluding high income)Middle East & North Africa (IDA & IBRD countries)Middle incomeMoldovaMongoliaMontenegroMoroccoMozambiqueMyanmarNamibiaNauruNepalNetherlandsNew ZealandNicaraguaNigerNigeriaNorth AmericaNorwayOECD membersOmanOther small statesPacific island small statesPakistanPalauPanamaPapua New GuineaParaguayPeruPhilippinesPolandPortugalPost-demographic dividendPre-demographic dividendPuerto RicoQatarRomaniaRussian FederationRwandaSamoaSan MarinoSao Tome and PrincipeSaudi ArabiaSenegalSerbiaSeychellesSierra LeoneSlovak RepublicSloveniaSmall statesSolomon IslandsSouth AfricaSouth AsiaSouth Asia (IDA & IBRD)South SudanSpainSri LankaSt. Kitts and NevisSt. LuciaSt. Vincent and the GrenadinesSub-Saharan Africa Sub-Saharan Africa (excluding high income)Sub-Saharan Africa (IDA & IBRD countries)SudanSurinameSwazilandSwedenSwitzerlandSyrian Arab RepublicTajikistanTanzaniaThailandTimor-LesteTogoTongaTrinidad and TobagoTunisiaTurkeyTuvaluUgandaUkraineUnited Arab EmiratesUnited StatesUpper middle incomeUruguayUzbekistanVanuatuVenezuela, RBVietnamWest Bank and GazaWorldYemen, Rep.ZambiaZimbabwe Timeline:
This timeline shows a graph from 1972 to 2015 of Cuba. No data until 1971. Number of actual observations by date: 43.
Source name:
World Development Indicators
Source organization:
UNESCO Institute for Statistics
Categories, topics:
Education
Last updated:
apr 23, 2017
Indicators value changes by year
Minimum:
84.206
jan 1, 2014
Maximum:
117.439
jan 1, 1972
At the date of observation
Value
Absolute change
Change from previous value
jan 1, 1972
117.439
+117.439
0.0%
jan 1, 1973
109.902
-7.537
-6.42%
jan 1, 1974
106.051
-3.852
-3.5%
jan 1, 1975
100.507
-5.543
-5.23%
jan 1, 1976
102.784
+2.276
2.26%
jan 1, 1977
103.724
+0.94
0.91%
jan 1, 1978
103.954
+0.23
0.22%
jan 1, 1979
116.579
+12.625
12.15%
jan 1, 1980
116.152
-0.427
-0.37%
jan 1, 1981
105.642
-10.51
-9.05%
jan 1, 1982
96.659
-8.983
-8.5%
jan 1, 1983
96.687
+0.029
0.03%
jan 1, 1984
98.742
+2.054
2.12%
jan 1, 1985
95.954
-2.787
-2.82%
jan 1, 1986
92.507
-3.447
-3.59%
jan 1, 1987
97.611
+5.104
5.52%
jan 1, 1988
97.035
-0.577
-0.59%
jan 1, 1989
94.908
-2.126
-2.19%
jan 1, 1990
107.056
+12.148
12.8%
jan 1, 1991
104.731
-2.325
-2.17%
jan 1, 1992
101.008
-3.723
-3.55%
jan 1, 1993
111.01
+10.002
9.9%
jan 1, 1994
95.353
-15.658
-14.1%
jan 1, 1995
100.771
+5.418
5.68%
jan 1, 1996
100.995
+0.225
0.22%
jan 1, 1997
102.168
+1.173
1.16%
jan 1, 1998
104.142
+1.974
1.93%
jan 1, 2000
90.083
-14.059
-13.5%
jan 1, 2001
90.77
+0.688
0.76%
jan 1, 2002
90.793
+0.022
0.02%
jan 1, 2003
93.34
+2.547
2.81%
jan 1, 2004
90.036
-3.304
-3.54%
jan 1, 2005
98.688
+8.652
9.61%
jan 1, 2006
98.125
-0.563
-0.57%
jan 1, 2007
98.854
+0.729
0.74%
jan 1, 2008
96.053
-2.8
-2.83%
jan 1, 2009
95.001
-1.052
-1.1%
jan 1, 2010
98.9
+3.899
4.1%
jan 1, 2011
97.884
-1.016
-1.03%
jan 1, 2012
92.624
-5.26
-5.37%
jan 1, 2013
89.476
-3.148
-3.4%
jan 1, 2014
84.206
-5.27
-5.89%
jan 1, 2015
86.608
+2.402
2.85%
Ranking of countries by current statistics by years


Comments: