29
/
en
AIzaSyAYiBZKx7MnpbEhh9jyipgxe19OcubqV5w
April 1, 2024
132056
Fiji
FJI
true
2
1
Gross intake ratio to Grade 1 of primary education, both sexes (%)
2014,2013,2012,2010,2009,2007,2005,2003,2002,2001,2000,1999,1998,1997,1996,1995,1993,1987,1986,1985,1984,1982,1981,1980,1979,1978,1977,1975,1974,1973
This statistics in other country:
AfghanistanAlbaniaAlgeriaAngolaAntigua and BarbudaArab WorldArgentinaArmeniaArubaAustriaAzerbaijanBahamas, TheBahrainBangladeshBarbadosBelarusBelgiumBelizeBeninBermudaBhutanBoliviaBosnia and HerzegovinaBotswanaBrazilBritish Virgin IslandsBrunei DarussalamBulgariaBurkina FasoBurundiCabo VerdeCambodiaCameroonCanadaCaribbean small statesCentral African RepublicCentral Europe and the BalticsChadChileChinaColombiaComorosCongo, Dem. Rep.Congo, Rep.Costa RicaCote d'IvoireCroatiaCubaCyprusCzech RepublicDenmarkDjiboutiDominicaDominican RepublicEarly-demographic dividendEast Asia & PacificEast Asia & Pacific (excluding high income)East Asia & Pacific (IDA & IBRD countries)EcuadorEgypt, Arab Rep.El SalvadorEquatorial GuineaEritreaEstoniaEthiopiaEuro areaEurope & Central AsiaEurope & Central Asia (excluding high income)Europe & Central Asia (IDA & IBRD countries)European UnionFijiFinlandFragile and conflict affected situationsFranceGabonGambia, TheGeorgiaGermanyGhanaGreeceGrenadaGuatemalaGuineaGuinea-BissauGuyanaHaitiHeavily indebted poor countries (HIPC)High incomeHondurasHong Kong SAR, ChinaHungaryIBRD onlyIcelandIDA & IBRD totalIDA blendIDA onlyIDA totalIndiaIndonesiaIran, Islamic Rep.IraqIrelandIsraelItalyJamaicaJapanJordanKazakhstanKenyaKiribatiKorea, Dem. People’s Rep.Korea, Rep.KuwaitKyrgyz RepublicLao PDRLate-demographic dividendLatin America & Caribbean Latin America & Caribbean (excluding high income)Latin America & the Caribbean (IDA & IBRD countries)LatviaLeast developed countries: UN classificationLebanonLesothoLiberiaLibyaLiechtensteinLithuaniaLow & middle incomeLow incomeLower middle incomeLuxembourgMacao SAR, ChinaMacedonia, FYRMadagascarMalawiMalaysiaMaldivesMaliMaltaMarshall IslandsMauritaniaMauritiusMexicoMicronesia, Fed. Sts.Middle East & North AfricaMiddle East & North Africa (excluding high income)Middle East & North Africa (IDA & IBRD countries)Middle incomeMoldovaMongoliaMontenegroMoroccoMozambiqueMyanmarNamibiaNauruNepalNetherlandsNew ZealandNicaraguaNigerNigeriaNorth AmericaNorwayOECD membersOmanOther small statesPacific island small statesPakistanPalauPanamaPapua New GuineaParaguayPeruPhilippinesPolandPortugalPost-demographic dividendPre-demographic dividendPuerto RicoQatarRomaniaRussian FederationRwandaSamoaSan MarinoSao Tome and PrincipeSaudi ArabiaSenegalSerbiaSeychellesSierra LeoneSlovak RepublicSloveniaSmall statesSolomon IslandsSouth AfricaSouth AsiaSouth Asia (IDA & IBRD)South SudanSpainSri LankaSt. Kitts and NevisSt. LuciaSt. Vincent and the GrenadinesSub-Saharan Africa Sub-Saharan Africa (excluding high income)Sub-Saharan Africa (IDA & IBRD countries)SudanSurinameSwazilandSwedenSwitzerlandSyrian Arab RepublicTajikistanTanzaniaThailandTimor-LesteTogoTongaTrinidad and TobagoTunisiaTurkeyTuvaluUgandaUkraineUnited Arab EmiratesUnited StatesUpper middle incomeUruguayUzbekistanVanuatuVenezuela, RBVietnamWest Bank and GazaWorldYemen, Rep.ZambiaZimbabwe Timeline:
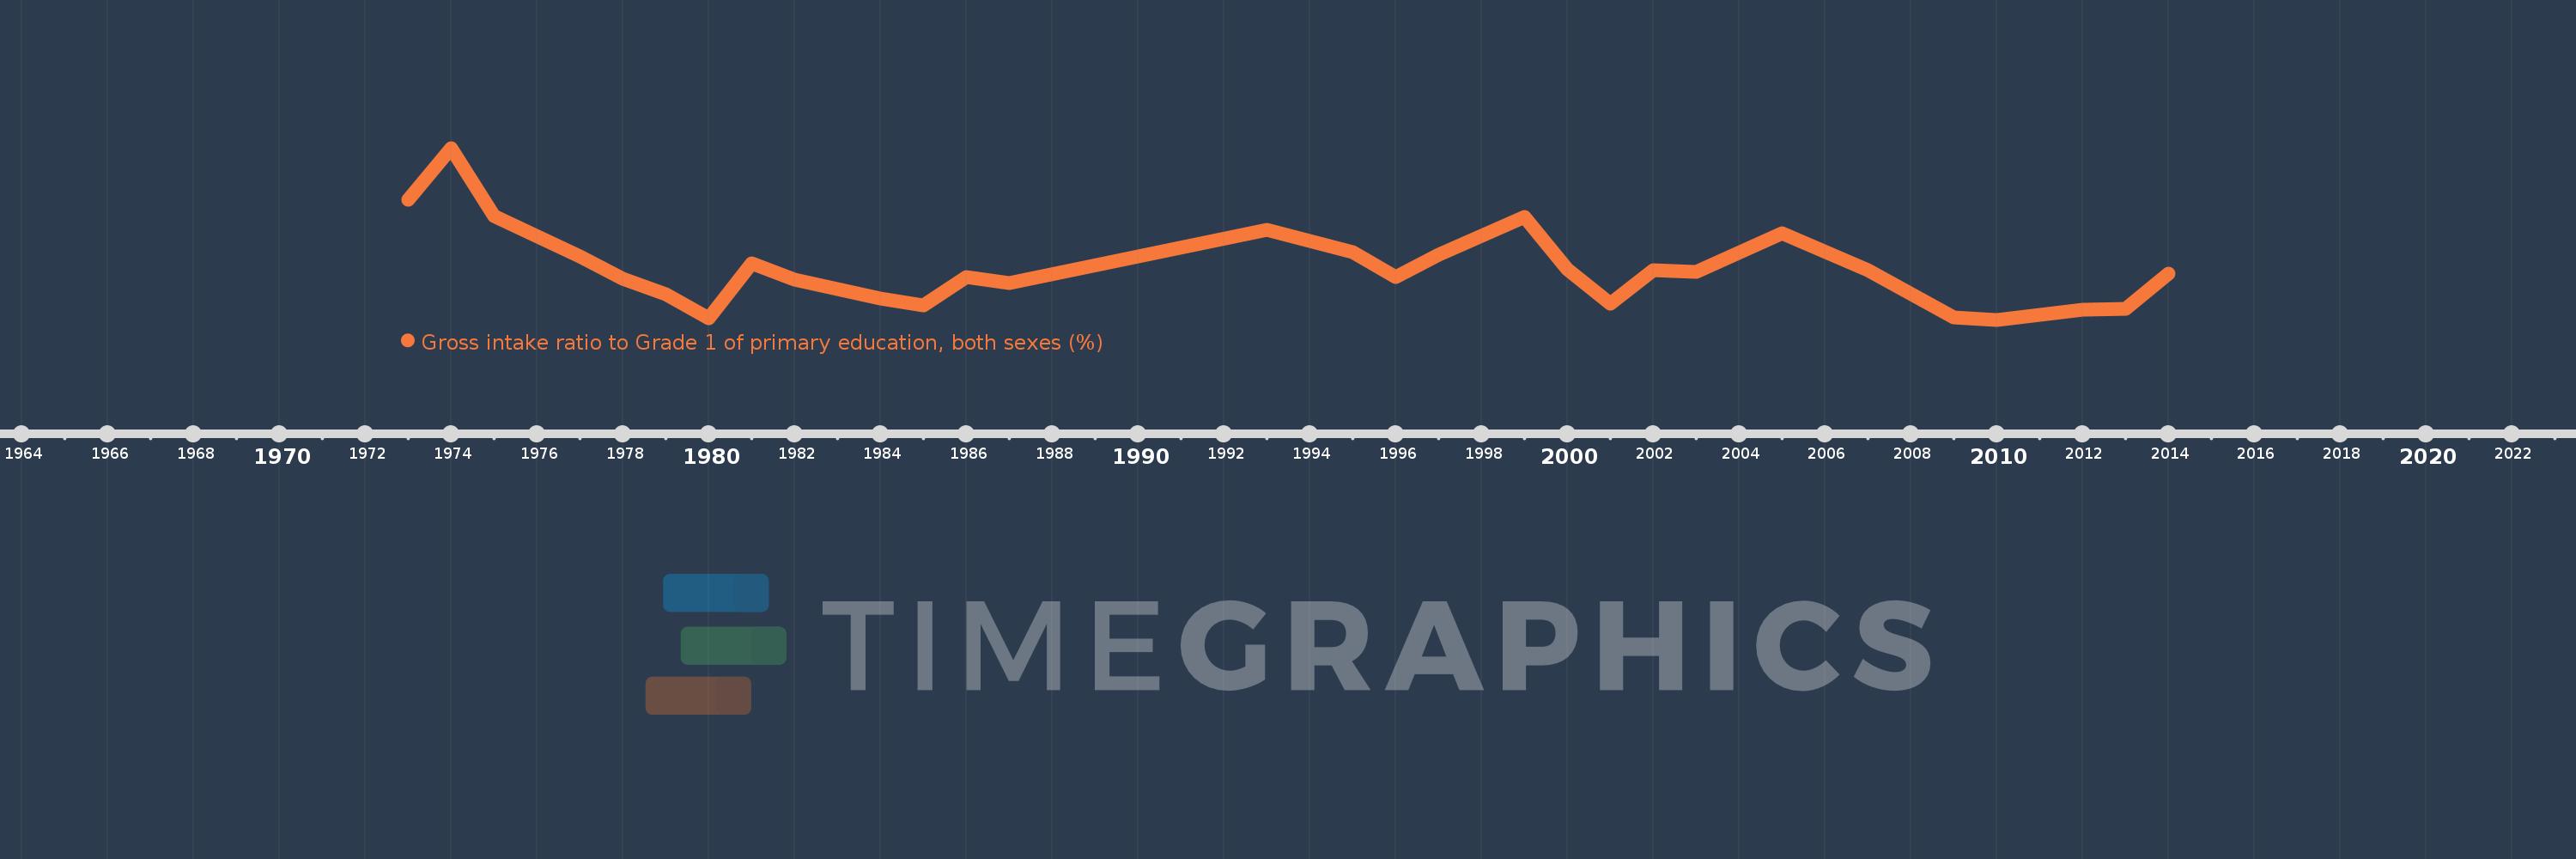
This timeline shows a graph from 1973 to 2014 of Fiji. No data until 1972. Number of actual observations by date: 30.
Source name:
World Development Indicators
Source organization:
UNESCO Institute for Statistics
Categories, topics:
Education
Last updated:
apr 23, 2017
Indicators value changes by year
Minimum:
102.185
jan 1, 2010
Maximum:
121.912
jan 1, 1974
At the date of observation
Value
Absolute change
Change from previous value
jan 1, 1973
115.921
+115.921
0.0%
jan 1, 1974
121.912
+5.991
5.17%
jan 1, 1975
114.073
-7.839
-6.43%
jan 1, 1977
109.471
-4.602
-4.03%
jan 1, 1978
106.894
-2.577
-2.35%
jan 1, 1979
105.127
-1.767
-1.65%
jan 1, 1980
102.362
-2.765
-2.63%
jan 1, 1981
108.661
+6.299
6.15%
jan 1, 1982
106.828
-1.832
-1.69%
jan 1, 1984
104.658
-2.17
-2.03%
jan 1, 1985
103.829
-0.829
-0.79%
jan 1, 1986
107.087
+3.258
3.14%
jan 1, 1987
106.367
-0.72
-0.67%
jan 1, 1993
112.522
+6.155
5.79%
jan 1, 1995
109.91
-2.612
-2.32%
jan 1, 1996
107.125
-2.785
-2.53%
jan 1, 1997
109.685
+2.559
2.39%
jan 1, 1998
111.853
+2.168
1.98%
jan 1, 1999
114.002
+2.148
1.92%
jan 1, 2000
108.012
-5.989
-5.25%
jan 1, 2001
103.984
-4.028
-3.73%
jan 1, 2002
107.856
+3.872
3.72%
jan 1, 2003
107.641
-0.215
-0.2%
jan 1, 2005
112.138
+4.496
4.18%
jan 1, 2007
107.879
-4.259
-3.8%
jan 1, 2009
102.45
-5.429
-5.03%
jan 1, 2010
102.185
-0.265
-0.26%
jan 1, 2012
103.355
+1.171
1.15%
jan 1, 2013
103.468
+0.113
0.11%
jan 1, 2014
107.457
+3.989
3.85%
Ranking of countries by current statistics by years


Comments: