29
/
en
AIzaSyAYiBZKx7MnpbEhh9jyipgxe19OcubqV5w
April 1, 2024
39957
IDA total
IDA
false
2
1
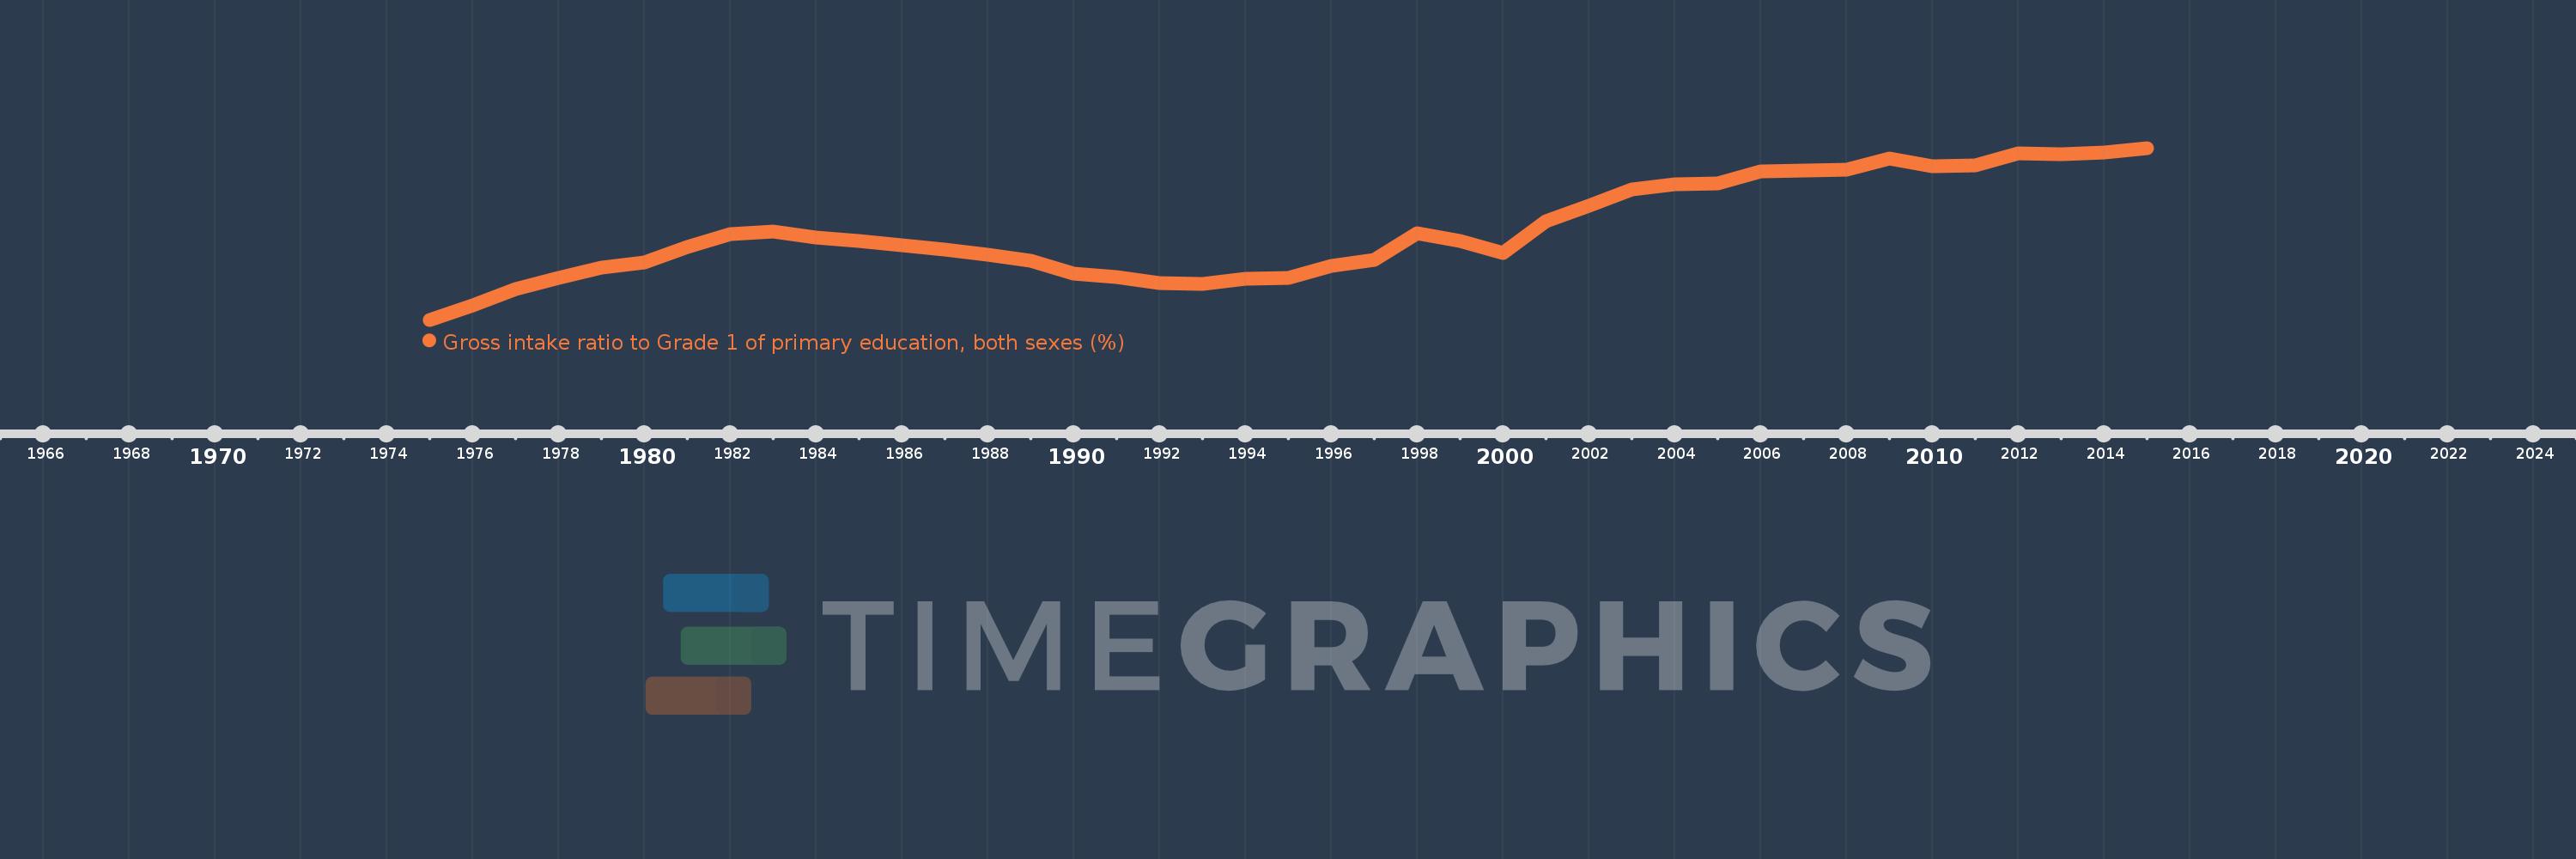
Gross intake ratio to Grade 1 of primary education, both sexes (%)
2015,2014,2013,2012,2011,2010,2009,2008,2007,2006,2005,2004,2003,2002,2001,2000,1999,1998,1997,1996,1995,1994,1993,1992,1991,1990,1989,1988,1987,1986,1985,1984,1983,1982,1981,1980,1979,1978,1977,1976,1975
This statistics in other country:
AfghanistanAlbaniaAlgeriaAngolaAntigua and BarbudaArab WorldArgentinaArmeniaArubaAustriaAzerbaijanBahamas, TheBahrainBangladeshBarbadosBelarusBelgiumBelizeBeninBermudaBhutanBoliviaBosnia and HerzegovinaBotswanaBrazilBritish Virgin IslandsBrunei DarussalamBulgariaBurkina FasoBurundiCabo VerdeCambodiaCameroonCanadaCaribbean small statesCentral African RepublicCentral Europe and the BalticsChadChileChinaColombiaComorosCongo, Dem. Rep.Congo, Rep.Costa RicaCote d'IvoireCroatiaCubaCyprusCzech RepublicDenmarkDjiboutiDominicaDominican RepublicEarly-demographic dividendEast Asia & PacificEast Asia & Pacific (excluding high income)East Asia & Pacific (IDA & IBRD countries)EcuadorEgypt, Arab Rep.El SalvadorEquatorial GuineaEritreaEstoniaEthiopiaEuro areaEurope & Central AsiaEurope & Central Asia (excluding high income)Europe & Central Asia (IDA & IBRD countries)European UnionFijiFinlandFragile and conflict affected situationsFranceGabonGambia, TheGeorgiaGermanyGhanaGreeceGrenadaGuatemalaGuineaGuinea-BissauGuyanaHaitiHeavily indebted poor countries (HIPC)High incomeHondurasHong Kong SAR, ChinaHungaryIBRD onlyIcelandIDA & IBRD totalIDA blendIDA onlyIDA totalIndiaIndonesiaIran, Islamic Rep.IraqIrelandIsraelItalyJamaicaJapanJordanKazakhstanKenyaKiribatiKorea, Dem. People’s Rep.Korea, Rep.KuwaitKyrgyz RepublicLao PDRLate-demographic dividendLatin America & Caribbean Latin America & Caribbean (excluding high income)Latin America & the Caribbean (IDA & IBRD countries)LatviaLeast developed countries: UN classificationLebanonLesothoLiberiaLibyaLiechtensteinLithuaniaLow & middle incomeLow incomeLower middle incomeLuxembourgMacao SAR, ChinaMacedonia, FYRMadagascarMalawiMalaysiaMaldivesMaliMaltaMarshall IslandsMauritaniaMauritiusMexicoMicronesia, Fed. Sts.Middle East & North AfricaMiddle East & North Africa (excluding high income)Middle East & North Africa (IDA & IBRD countries)Middle incomeMoldovaMongoliaMontenegroMoroccoMozambiqueMyanmarNamibiaNauruNepalNetherlandsNew ZealandNicaraguaNigerNigeriaNorth AmericaNorwayOECD membersOmanOther small statesPacific island small statesPakistanPalauPanamaPapua New GuineaParaguayPeruPhilippinesPolandPortugalPost-demographic dividendPre-demographic dividendPuerto RicoQatarRomaniaRussian FederationRwandaSamoaSan MarinoSao Tome and PrincipeSaudi ArabiaSenegalSerbiaSeychellesSierra LeoneSlovak RepublicSloveniaSmall statesSolomon IslandsSouth AfricaSouth AsiaSouth Asia (IDA & IBRD)South SudanSpainSri LankaSt. Kitts and NevisSt. LuciaSt. Vincent and the GrenadinesSub-Saharan Africa Sub-Saharan Africa (excluding high income)Sub-Saharan Africa (IDA & IBRD countries)SudanSurinameSwazilandSwedenSwitzerlandSyrian Arab RepublicTajikistanTanzaniaThailandTimor-LesteTogoTongaTrinidad and TobagoTunisiaTurkeyTuvaluUgandaUkraineUnited Arab EmiratesUnited StatesUpper middle incomeUruguayUzbekistanVanuatuVenezuela, RBVietnamWest Bank and GazaWorldYemen, Rep.ZambiaZimbabwe Timeline:
This timeline shows a graph from 1975 to 2015 of IDA total. No data until 1974. Number of actual observations by date: 41.
Source name:
World Development Indicators
Source organization:
UNESCO Institute for Statistics
Categories, topics:
Education
Last updated:
apr 23, 2017
Indicators value changes by year
Minimum:
87.385
jan 1, 1975
Maximum:
115.299
jan 1, 2015
At the date of observation
Value
Absolute change
Change from previous value
jan 1, 1975
87.385
+87.385
0.0%
jan 1, 1976
89.78
+2.394
2.74%
jan 1, 1977
92.347
+2.567
2.86%
jan 1, 1978
94.12
+1.773
1.92%
jan 1, 1979
95.899
+1.779
1.89%
jan 1, 1980
96.735
+0.836
0.87%
jan 1, 1981
99.234
+2.499
2.58%
jan 1, 1982
101.368
+2.133
2.15%
jan 1, 1983
101.723
+0.355
0.35%
jan 1, 1984
100.797
-0.926
-0.91%
jan 1, 1985
100.166
-0.63
-0.63%
jan 1, 1986
99.451
-0.715
-0.71%
jan 1, 1987
98.83
-0.621
-0.62%
jan 1, 1988
97.918
-0.911
-0.92%
jan 1, 1989
96.939
-0.979
-1.0%
jan 1, 1990
94.925
-2.015
-2.08%
jan 1, 1991
94.304
-0.62
-0.65%
jan 1, 1992
93.381
-0.923
-0.98%
jan 1, 1993
93.142
-0.239
-0.26%
jan 1, 1994
93.973
+0.831
0.89%
jan 1, 1995
94.236
+0.263
0.28%
jan 1, 1996
96.116
+1.88
2.0%
jan 1, 1997
97.152
+1.036
1.08%
jan 1, 1998
101.435
+4.282
4.41%
jan 1, 1999
100.159
-1.276
-1.26%
jan 1, 2000
98.285
-1.873
-1.87%
jan 1, 2001
103.39
+5.105
5.19%
jan 1, 2002
105.943
+2.552
2.47%
jan 1, 2003
108.507
+2.565
2.42%
jan 1, 2004
109.413
+0.905
0.83%
jan 1, 2005
109.51
+0.097
0.09%
jan 1, 2006
111.513
+2.003
1.83%
jan 1, 2007
111.645
+0.132
0.12%
jan 1, 2008
111.727
+0.082
0.07%
jan 1, 2009
113.569
+1.842
1.65%
jan 1, 2010
112.26
-1.309
-1.15%
jan 1, 2011
112.42
+0.16
0.14%
jan 1, 2012
114.414
+1.994
1.77%
jan 1, 2013
114.275
-0.139
-0.12%
jan 1, 2014
114.559
+0.284
0.25%
jan 1, 2015
115.299
+0.74
0.65%
Ranking of countries by current statistics by years


Comments: