29
/
en
AIzaSyAYiBZKx7MnpbEhh9jyipgxe19OcubqV5w
April 1, 2024
47175
Lower middle income
LMC
false
2
1
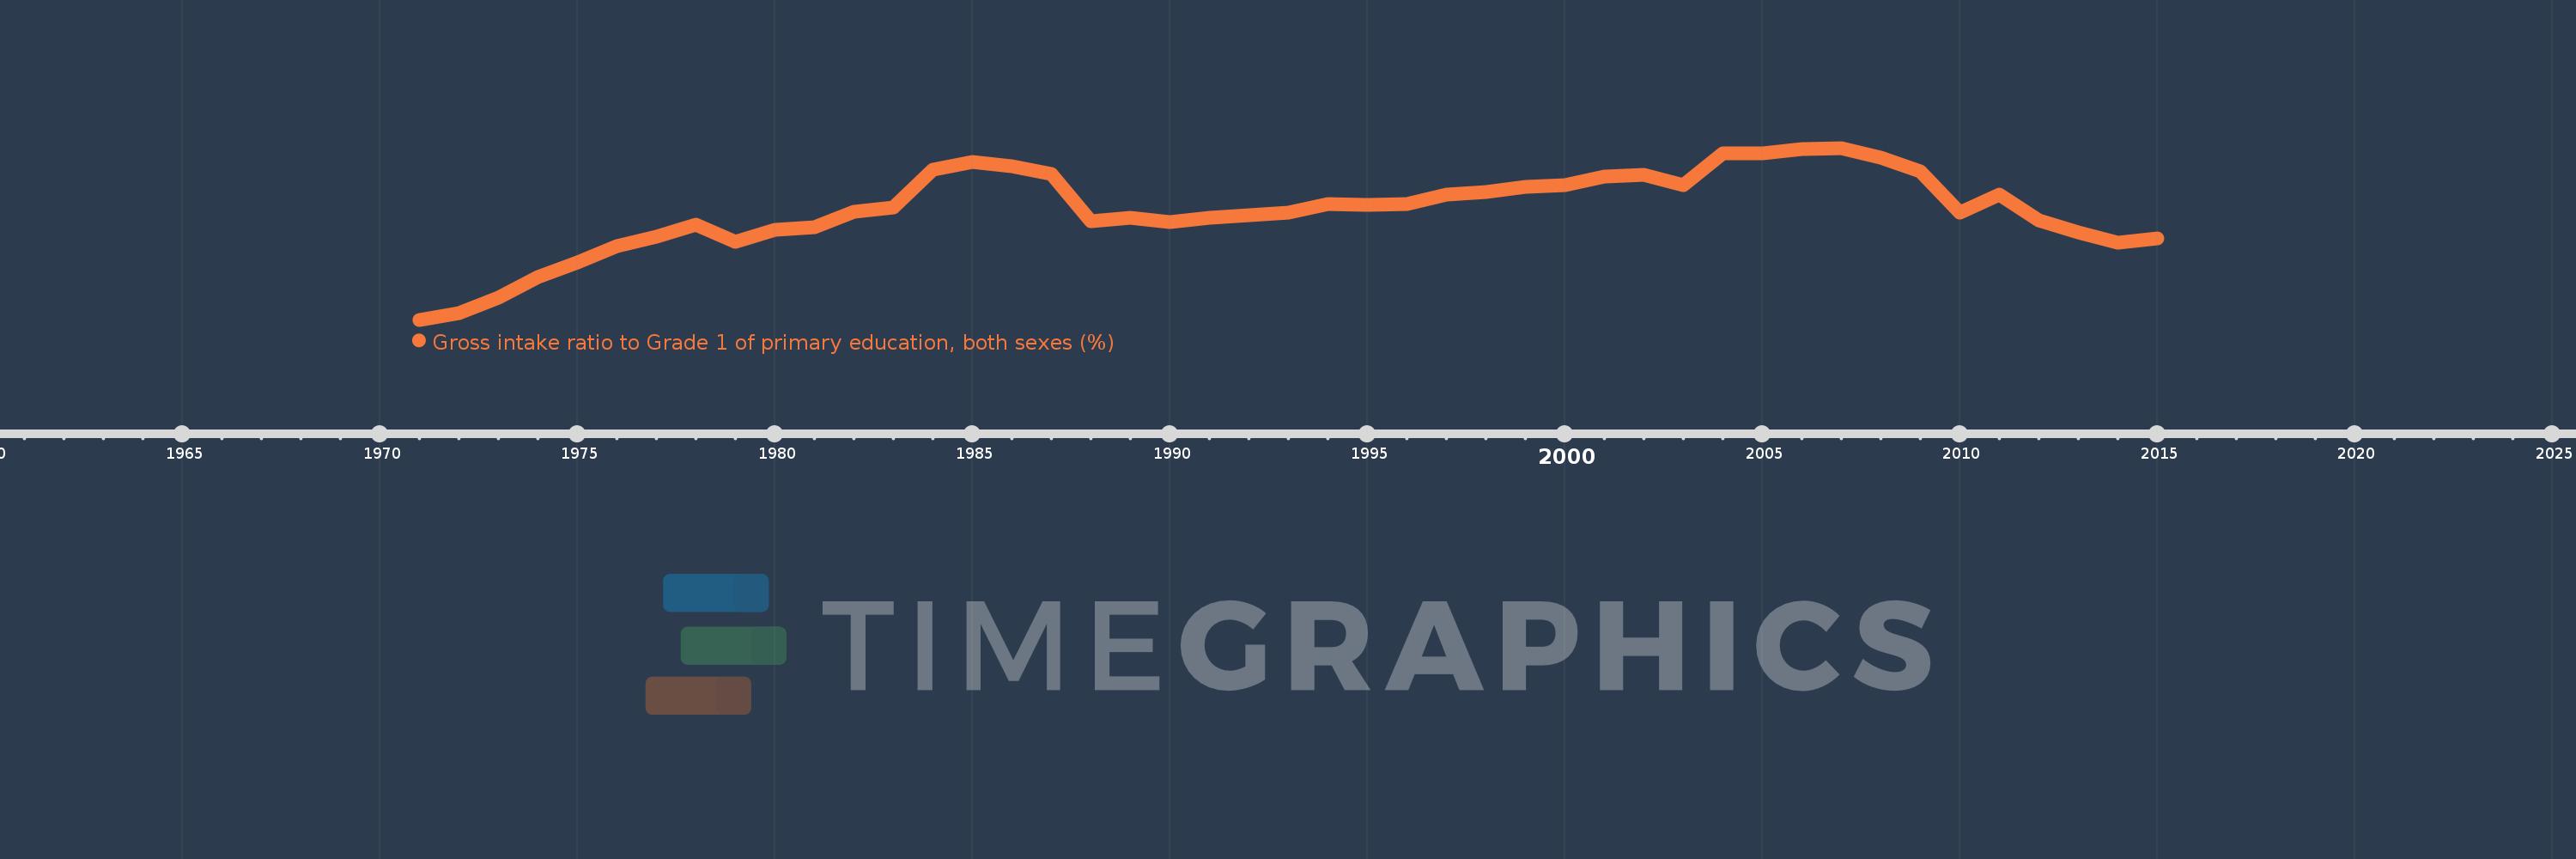
Gross intake ratio to Grade 1 of primary education, both sexes (%)
2015,2014,2013,2012,2011,2010,2009,2008,2007,2006,2005,2004,2003,2002,2001,2000,1999,1998,1997,1996,1995,1994,1993,1992,1991,1990,1989,1988,1987,1986,1985,1984,1983,1982,1981,1980,1979,1978,1977,1976,1975,1974,1973,1972,1971
This statistics in other country:
AfghanistanAlbaniaAlgeriaAngolaAntigua and BarbudaArab WorldArgentinaArmeniaArubaAustriaAzerbaijanBahamas, TheBahrainBangladeshBarbadosBelarusBelgiumBelizeBeninBermudaBhutanBoliviaBosnia and HerzegovinaBotswanaBrazilBritish Virgin IslandsBrunei DarussalamBulgariaBurkina FasoBurundiCabo VerdeCambodiaCameroonCanadaCaribbean small statesCentral African RepublicCentral Europe and the BalticsChadChileChinaColombiaComorosCongo, Dem. Rep.Congo, Rep.Costa RicaCote d'IvoireCroatiaCubaCyprusCzech RepublicDenmarkDjiboutiDominicaDominican RepublicEarly-demographic dividendEast Asia & PacificEast Asia & Pacific (excluding high income)East Asia & Pacific (IDA & IBRD countries)EcuadorEgypt, Arab Rep.El SalvadorEquatorial GuineaEritreaEstoniaEthiopiaEuro areaEurope & Central AsiaEurope & Central Asia (excluding high income)Europe & Central Asia (IDA & IBRD countries)European UnionFijiFinlandFragile and conflict affected situationsFranceGabonGambia, TheGeorgiaGermanyGhanaGreeceGrenadaGuatemalaGuineaGuinea-BissauGuyanaHaitiHeavily indebted poor countries (HIPC)High incomeHondurasHong Kong SAR, ChinaHungaryIBRD onlyIcelandIDA & IBRD totalIDA blendIDA onlyIDA totalIndiaIndonesiaIran, Islamic Rep.IraqIrelandIsraelItalyJamaicaJapanJordanKazakhstanKenyaKiribatiKorea, Dem. People’s Rep.Korea, Rep.KuwaitKyrgyz RepublicLao PDRLate-demographic dividendLatin America & Caribbean Latin America & Caribbean (excluding high income)Latin America & the Caribbean (IDA & IBRD countries)LatviaLeast developed countries: UN classificationLebanonLesothoLiberiaLibyaLiechtensteinLithuaniaLow & middle incomeLow incomeLower middle incomeLuxembourgMacao SAR, ChinaMacedonia, FYRMadagascarMalawiMalaysiaMaldivesMaliMaltaMarshall IslandsMauritaniaMauritiusMexicoMicronesia, Fed. Sts.Middle East & North AfricaMiddle East & North Africa (excluding high income)Middle East & North Africa (IDA & IBRD countries)Middle incomeMoldovaMongoliaMontenegroMoroccoMozambiqueMyanmarNamibiaNauruNepalNetherlandsNew ZealandNicaraguaNigerNigeriaNorth AmericaNorwayOECD membersOmanOther small statesPacific island small statesPakistanPalauPanamaPapua New GuineaParaguayPeruPhilippinesPolandPortugalPost-demographic dividendPre-demographic dividendPuerto RicoQatarRomaniaRussian FederationRwandaSamoaSan MarinoSao Tome and PrincipeSaudi ArabiaSenegalSerbiaSeychellesSierra LeoneSlovak RepublicSloveniaSmall statesSolomon IslandsSouth AfricaSouth AsiaSouth Asia (IDA & IBRD)South SudanSpainSri LankaSt. Kitts and NevisSt. LuciaSt. Vincent and the GrenadinesSub-Saharan Africa Sub-Saharan Africa (excluding high income)Sub-Saharan Africa (IDA & IBRD countries)SudanSurinameSwazilandSwedenSwitzerlandSyrian Arab RepublicTajikistanTanzaniaThailandTimor-LesteTogoTongaTrinidad and TobagoTunisiaTurkeyTuvaluUgandaUkraineUnited Arab EmiratesUnited StatesUpper middle incomeUruguayUzbekistanVanuatuVenezuela, RBVietnamWest Bank and GazaWorldYemen, Rep.ZambiaZimbabwe Timeline:
This timeline shows a graph from 1971 to 2015 of Lower middle income. No data until 1970. Number of actual observations by date: 45.
Source name:
World Development Indicators
Source organization:
UNESCO Institute for Statistics
Categories, topics:
Education
Last updated:
apr 23, 2017
Indicators value changes by year
Maximum:
117.688
jan 1, 2007
At the date of observation
Value
Absolute change
Change from previous value
jan 1, 1971
95.29
+95.29
0.0%
jan 1, 1972
96.113
+0.823
0.86%
jan 1, 1973
98.171
+2.058
2.14%
jan 1, 1974
100.8
+2.629
2.68%
jan 1, 1975
102.748
+1.948
1.93%
jan 1, 1976
104.928
+2.179
2.12%
jan 1, 1977
106.095
+1.167
1.11%
jan 1, 1978
107.713
+1.618
1.53%
jan 1, 1979
105.467
-2.245
-2.08%
jan 1, 1980
107.033
+1.566
1.48%
jan 1, 1981
107.348
+0.314
0.29%
jan 1, 1982
109.348
+2.0
1.86%
jan 1, 1983
109.98
+0.632
0.58%
jan 1, 1984
114.89
+4.91
4.46%
jan 1, 1985
115.913
+1.023
0.89%
jan 1, 1986
115.323
-0.59
-0.51%
jan 1, 1987
114.266
-1.057
-0.92%
jan 1, 1988
108.169
-6.098
-5.34%
jan 1, 1989
108.638
+0.47
0.43%
jan 1, 1990
108.011
-0.627
-0.58%
jan 1, 1991
108.552
+0.541
0.5%
jan 1, 1992
108.884
+0.331
0.31%
jan 1, 1993
109.304
+0.42
0.39%
jan 1, 1994
110.407
+1.102
1.01%
jan 1, 1995
110.293
-0.114
-0.1%
jan 1, 1996
110.358
+0.065
0.06%
jan 1, 1997
111.552
+1.194
1.08%
jan 1, 1998
111.952
+0.4
0.36%
jan 1, 1999
112.607
+0.655
0.58%
jan 1, 2000
112.82
+0.213
0.19%
jan 1, 2001
113.985
+1.165
1.03%
jan 1, 2002
114.185
+0.2
0.18%
jan 1, 2003
112.867
-1.317
-1.15%
jan 1, 2004
117.031
+4.163
3.69%
jan 1, 2005
117.012
-0.018
-0.02%
jan 1, 2006
117.581
+0.569
0.49%
jan 1, 2007
117.688
+0.107
0.09%
jan 1, 2008
116.457
-1.232
-1.05%
jan 1, 2009
114.632
-1.825
-1.57%
jan 1, 2010
109.27
-5.362
-4.68%
jan 1, 2011
111.569
+2.299
2.1%
jan 1, 2012
108.281
-3.288
-2.95%
jan 1, 2013
106.683
-1.597
-1.48%
jan 1, 2014
105.3
-1.384
-1.3%
jan 1, 2015
105.844
+0.544
0.52%
Ranking of countries by current statistics by years


Comments: