29
/
en
AIzaSyAYiBZKx7MnpbEhh9jyipgxe19OcubqV5w
April 1, 2024
58969
Sub-Saharan Africa
SSF
false
2
1
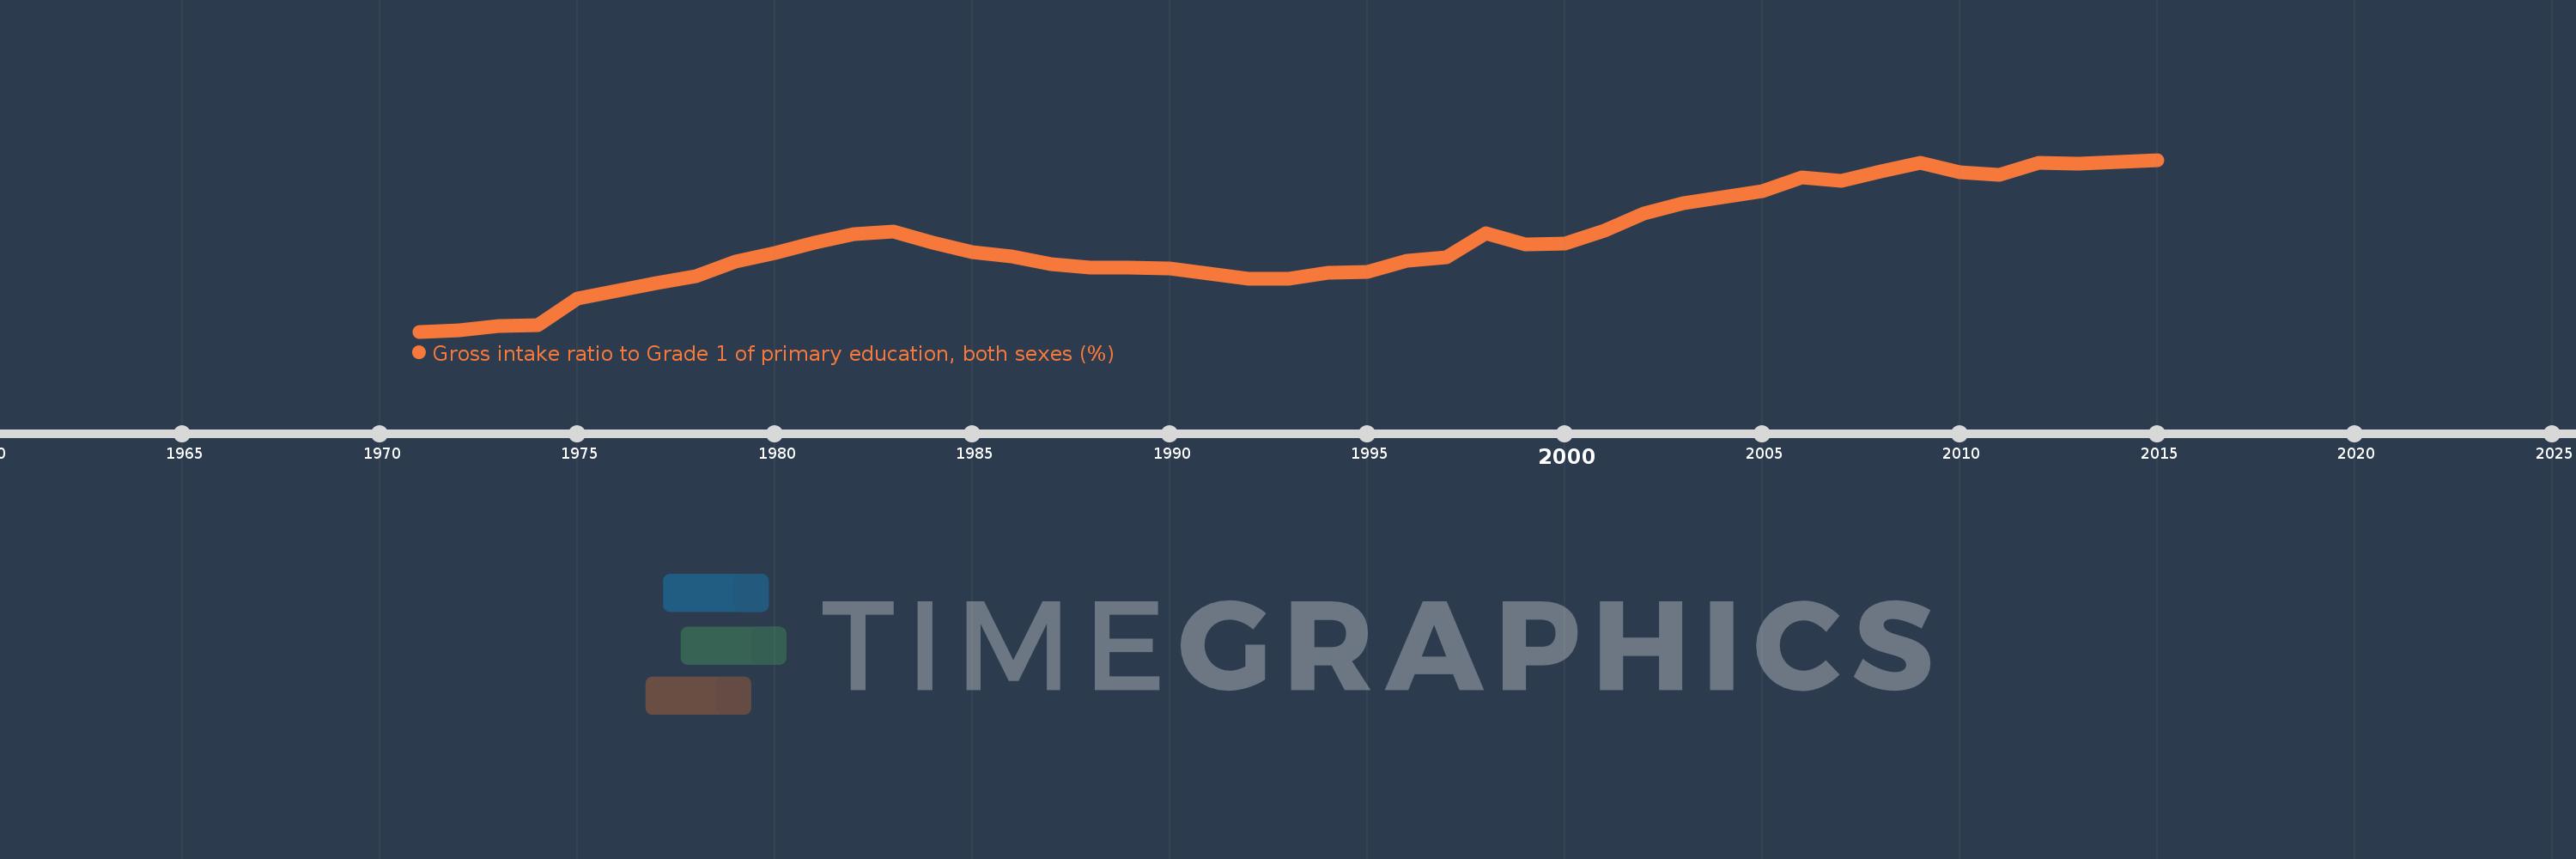
Gross intake ratio to Grade 1 of primary education, both sexes (%)
2015,2014,2013,2012,2011,2010,2009,2008,2007,2006,2005,2004,2003,2002,2001,2000,1999,1998,1997,1996,1995,1994,1993,1992,1991,1990,1989,1988,1987,1986,1985,1984,1983,1982,1981,1980,1979,1978,1977,1976,1975,1974,1973,1972,1971
This statistics in other country:
AfghanistanAlbaniaAlgeriaAngolaAntigua and BarbudaArab WorldArgentinaArmeniaArubaAustriaAzerbaijanBahamas, TheBahrainBangladeshBarbadosBelarusBelgiumBelizeBeninBermudaBhutanBoliviaBosnia and HerzegovinaBotswanaBrazilBritish Virgin IslandsBrunei DarussalamBulgariaBurkina FasoBurundiCabo VerdeCambodiaCameroonCanadaCaribbean small statesCentral African RepublicCentral Europe and the BalticsChadChileChinaColombiaComorosCongo, Dem. Rep.Congo, Rep.Costa RicaCote d'IvoireCroatiaCubaCyprusCzech RepublicDenmarkDjiboutiDominicaDominican RepublicEarly-demographic dividendEast Asia & PacificEast Asia & Pacific (excluding high income)East Asia & Pacific (IDA & IBRD countries)EcuadorEgypt, Arab Rep.El SalvadorEquatorial GuineaEritreaEstoniaEthiopiaEuro areaEurope & Central AsiaEurope & Central Asia (excluding high income)Europe & Central Asia (IDA & IBRD countries)European UnionFijiFinlandFragile and conflict affected situationsFranceGabonGambia, TheGeorgiaGermanyGhanaGreeceGrenadaGuatemalaGuineaGuinea-BissauGuyanaHaitiHeavily indebted poor countries (HIPC)High incomeHondurasHong Kong SAR, ChinaHungaryIBRD onlyIcelandIDA & IBRD totalIDA blendIDA onlyIDA totalIndiaIndonesiaIran, Islamic Rep.IraqIrelandIsraelItalyJamaicaJapanJordanKazakhstanKenyaKiribatiKorea, Dem. People’s Rep.Korea, Rep.KuwaitKyrgyz RepublicLao PDRLate-demographic dividendLatin America & Caribbean Latin America & Caribbean (excluding high income)Latin America & the Caribbean (IDA & IBRD countries)LatviaLeast developed countries: UN classificationLebanonLesothoLiberiaLibyaLiechtensteinLithuaniaLow & middle incomeLow incomeLower middle incomeLuxembourgMacao SAR, ChinaMacedonia, FYRMadagascarMalawiMalaysiaMaldivesMaliMaltaMarshall IslandsMauritaniaMauritiusMexicoMicronesia, Fed. Sts.Middle East & North AfricaMiddle East & North Africa (excluding high income)Middle East & North Africa (IDA & IBRD countries)Middle incomeMoldovaMongoliaMontenegroMoroccoMozambiqueMyanmarNamibiaNauruNepalNetherlandsNew ZealandNicaraguaNigerNigeriaNorth AmericaNorwayOECD membersOmanOther small statesPacific island small statesPakistanPalauPanamaPapua New GuineaParaguayPeruPhilippinesPolandPortugalPost-demographic dividendPre-demographic dividendPuerto RicoQatarRomaniaRussian FederationRwandaSamoaSan MarinoSao Tome and PrincipeSaudi ArabiaSenegalSerbiaSeychellesSierra LeoneSlovak RepublicSloveniaSmall statesSolomon IslandsSouth AfricaSouth AsiaSouth Asia (IDA & IBRD)South SudanSpainSri LankaSt. Kitts and NevisSt. LuciaSt. Vincent and the GrenadinesSub-Saharan Africa Sub-Saharan Africa (excluding high income)Sub-Saharan Africa (IDA & IBRD countries)SudanSurinameSwazilandSwedenSwitzerlandSyrian Arab RepublicTajikistanTanzaniaThailandTimor-LesteTogoTongaTrinidad and TobagoTunisiaTurkeyTuvaluUgandaUkraineUnited Arab EmiratesUnited StatesUpper middle incomeUruguayUzbekistanVanuatuVenezuela, RBVietnamWest Bank and GazaWorldYemen, Rep.ZambiaZimbabwe Timeline:
This timeline shows a graph from 1971 to 2015 of Sub-Saharan Africa . No data until 1970. Number of actual observations by date: 45.
Source name:
World Development Indicators
Source organization:
UNESCO Institute for Statistics
Categories, topics:
Education
Last updated:
apr 23, 2017
Indicators value changes by year
Minimum:
67.042
jan 1, 1971
Maximum:
114.626
jan 1, 2015
At the date of observation
Value
Absolute change
Change from previous value
jan 1, 1971
67.042
+67.042
0.0%
jan 1, 1972
67.281
+0.239
0.36%
jan 1, 1973
68.563
+1.282
1.91%
jan 1, 1974
68.78
+0.217
0.32%
jan 1, 1975
76.28
+7.5
10.9%
jan 1, 1976
78.322
+2.042
2.68%
jan 1, 1977
80.592
+2.27
2.9%
jan 1, 1978
82.319
+1.728
2.14%
jan 1, 1979
86.377
+4.058
4.93%
jan 1, 1980
88.722
+2.345
2.71%
jan 1, 1981
91.692
+2.97
3.35%
jan 1, 1982
94.129
+2.437
2.66%
jan 1, 1983
94.722
+0.594
0.63%
jan 1, 1984
91.583
-3.14
-3.31%
jan 1, 1985
89.053
-2.53
-2.76%
jan 1, 1986
87.77
-1.283
-1.44%
jan 1, 1987
85.67
-2.101
-2.39%
jan 1, 1988
84.716
-0.954
-1.11%
jan 1, 1989
84.88
+0.164
0.19%
jan 1, 1990
84.604
-0.276
-0.32%
jan 1, 1991
83.014
-1.59
-1.88%
jan 1, 1992
81.792
-1.222
-1.47%
jan 1, 1993
81.72
-0.072
-0.09%
jan 1, 1994
83.259
+1.539
1.88%
jan 1, 1995
83.638
+0.379
0.46%
jan 1, 1996
86.707
+3.069
3.67%
jan 1, 1997
87.652
+0.945
1.09%
jan 1, 1998
94.363
+6.711
7.66%
jan 1, 1999
91.188
-3.174
-3.36%
jan 1, 2000
91.353
+0.165
0.18%
jan 1, 2001
95.027
+3.674
4.02%
jan 1, 2002
99.773
+4.746
4.99%
jan 1, 2003
102.517
+2.744
2.75%
jan 1, 2004
104.265
+1.748
1.71%
jan 1, 2005
105.836
+1.571
1.51%
jan 1, 2006
109.832
+3.995
3.78%
jan 1, 2007
108.892
-0.939
-0.86%
jan 1, 2008
111.36
+2.467
2.27%
jan 1, 2009
113.776
+2.417
2.17%
jan 1, 2010
111.239
-2.537
-2.23%
jan 1, 2011
110.481
-0.758
-0.68%
jan 1, 2012
113.874
+3.393
3.07%
jan 1, 2013
113.637
-0.237
-0.21%
jan 1, 2014
114.069
+0.431
0.38%
jan 1, 2015
114.626
+0.558
0.49%
Ranking of countries by current statistics by years


Comments: