29
/
en
AIzaSyAYiBZKx7MnpbEhh9jyipgxe19OcubqV5w
April 1, 2024
141871
Greece
GRC
true
2
1
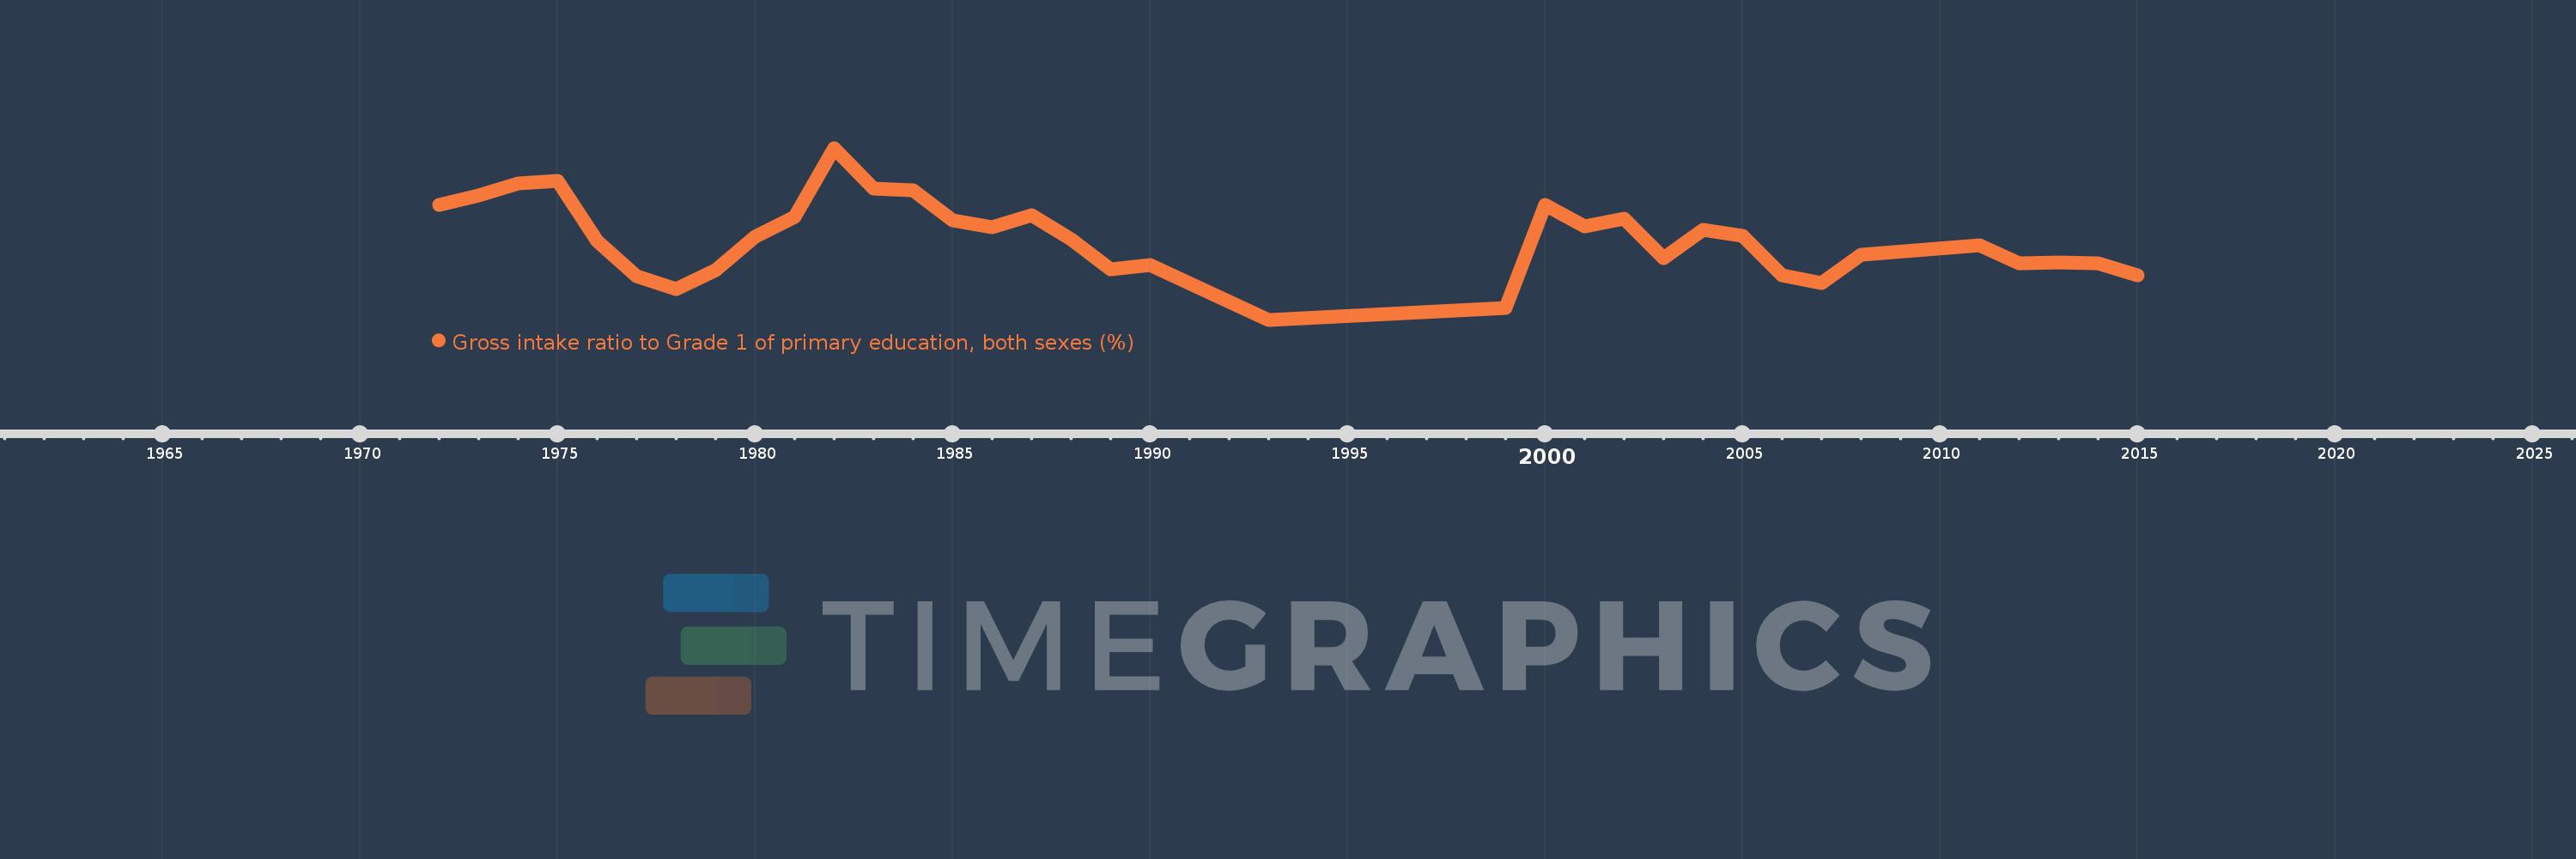
Gross intake ratio to Grade 1 of primary education, both sexes (%)
2015,2014,2013,2012,2011,2008,2007,2006,2005,2004,2003,2002,2001,2000,1999,1993,1990,1989,1988,1987,1986,1985,1984,1983,1982,1981,1980,1979,1978,1977,1976,1975,1974,1973,1972
This statistics in other country:
AfghanistanAlbaniaAlgeriaAngolaAntigua and BarbudaArab WorldArgentinaArmeniaArubaAustriaAzerbaijanBahamas, TheBahrainBangladeshBarbadosBelarusBelgiumBelizeBeninBermudaBhutanBoliviaBosnia and HerzegovinaBotswanaBrazilBritish Virgin IslandsBrunei DarussalamBulgariaBurkina FasoBurundiCabo VerdeCambodiaCameroonCanadaCaribbean small statesCentral African RepublicCentral Europe and the BalticsChadChileChinaColombiaComorosCongo, Dem. Rep.Congo, Rep.Costa RicaCote d'IvoireCroatiaCubaCyprusCzech RepublicDenmarkDjiboutiDominicaDominican RepublicEarly-demographic dividendEast Asia & PacificEast Asia & Pacific (excluding high income)East Asia & Pacific (IDA & IBRD countries)EcuadorEgypt, Arab Rep.El SalvadorEquatorial GuineaEritreaEstoniaEthiopiaEuro areaEurope & Central AsiaEurope & Central Asia (excluding high income)Europe & Central Asia (IDA & IBRD countries)European UnionFijiFinlandFragile and conflict affected situationsFranceGabonGambia, TheGeorgiaGermanyGhanaGreeceGrenadaGuatemalaGuineaGuinea-BissauGuyanaHaitiHeavily indebted poor countries (HIPC)High incomeHondurasHong Kong SAR, ChinaHungaryIBRD onlyIcelandIDA & IBRD totalIDA blendIDA onlyIDA totalIndiaIndonesiaIran, Islamic Rep.IraqIrelandIsraelItalyJamaicaJapanJordanKazakhstanKenyaKiribatiKorea, Dem. People’s Rep.Korea, Rep.KuwaitKyrgyz RepublicLao PDRLate-demographic dividendLatin America & Caribbean Latin America & Caribbean (excluding high income)Latin America & the Caribbean (IDA & IBRD countries)LatviaLeast developed countries: UN classificationLebanonLesothoLiberiaLibyaLiechtensteinLithuaniaLow & middle incomeLow incomeLower middle incomeLuxembourgMacao SAR, ChinaMacedonia, FYRMadagascarMalawiMalaysiaMaldivesMaliMaltaMarshall IslandsMauritaniaMauritiusMexicoMicronesia, Fed. Sts.Middle East & North AfricaMiddle East & North Africa (excluding high income)Middle East & North Africa (IDA & IBRD countries)Middle incomeMoldovaMongoliaMontenegroMoroccoMozambiqueMyanmarNamibiaNauruNepalNetherlandsNew ZealandNicaraguaNigerNigeriaNorth AmericaNorwayOECD membersOmanOther small statesPacific island small statesPakistanPalauPanamaPapua New GuineaParaguayPeruPhilippinesPolandPortugalPost-demographic dividendPre-demographic dividendPuerto RicoQatarRomaniaRussian FederationRwandaSamoaSan MarinoSao Tome and PrincipeSaudi ArabiaSenegalSerbiaSeychellesSierra LeoneSlovak RepublicSloveniaSmall statesSolomon IslandsSouth AfricaSouth AsiaSouth Asia (IDA & IBRD)South SudanSpainSri LankaSt. Kitts and NevisSt. LuciaSt. Vincent and the GrenadinesSub-Saharan Africa Sub-Saharan Africa (excluding high income)Sub-Saharan Africa (IDA & IBRD countries)SudanSurinameSwazilandSwedenSwitzerlandSyrian Arab RepublicTajikistanTanzaniaThailandTimor-LesteTogoTongaTrinidad and TobagoTunisiaTurkeyTuvaluUgandaUkraineUnited Arab EmiratesUnited StatesUpper middle incomeUruguayUzbekistanVanuatuVenezuela, RBVietnamWest Bank and GazaWorldYemen, Rep.ZambiaZimbabwe Timeline:
This timeline shows a graph from 1972 to 2015 of Greece. No data until 1971. Number of actual observations by date: 35.
Source name:
World Development Indicators
Source organization:
UNESCO Institute for Statistics
Categories, topics:
Education
Last updated:
apr 23, 2017
Indicators value changes by year
Minimum:
94.532
jan 1, 1993
Maximum:
111.558
jan 1, 1982
At the date of observation
Value
Absolute change
Change from previous value
jan 1, 1972
105.892
+105.892
0.0%
jan 1, 1973
106.833
+0.941
0.89%
jan 1, 1974
108.066
+1.233
1.15%
jan 1, 1975
108.273
+0.208
0.19%
jan 1, 1976
102.359
-5.914
-5.46%
jan 1, 1977
98.832
-3.527
-3.45%
jan 1, 1978
97.588
-1.244
-1.26%
jan 1, 1979
99.449
+1.861
1.91%
jan 1, 1980
102.793
+3.344
3.36%
jan 1, 1981
104.71
+1.918
1.87%
jan 1, 1982
111.558
+6.848
6.54%
jan 1, 1983
107.525
-4.033
-3.61%
jan 1, 1984
107.366
-0.159
-0.15%
jan 1, 1985
104.402
-2.964
-2.76%
jan 1, 1986
103.68
-0.722
-0.69%
jan 1, 1987
104.903
+1.222
1.18%
jan 1, 1988
102.536
-2.367
-2.26%
jan 1, 1989
99.557
-2.978
-2.9%
jan 1, 1990
99.993
+0.435
0.44%
jan 1, 1993
94.532
-5.461
-5.46%
jan 1, 1999
95.737
+1.205
1.27%
jan 1, 2000
105.92
+10.184
10.64%
jan 1, 2001
103.801
-2.119
-2.0%
jan 1, 2002
104.515
+0.714
0.69%
jan 1, 2003
100.645
-3.871
-3.7%
jan 1, 2004
103.415
+2.77
2.75%
jan 1, 2005
102.814
-0.601
-0.58%
jan 1, 2006
98.894
-3.919
-3.81%
jan 1, 2007
98.191
-0.703
-0.71%
jan 1, 2008
100.978
+2.787
2.84%
jan 1, 2011
101.904
+0.926
0.92%
jan 1, 2012
100.091
-1.813
-1.78%
jan 1, 2013
100.213
+0.122
0.12%
jan 1, 2014
100.167
-0.047
-0.05%
jan 1, 2015
98.934
-1.232
-1.23%
Ranking of countries by current statistics by years


Comments: