29
/
en
AIzaSyAYiBZKx7MnpbEhh9jyipgxe19OcubqV5w
April 1, 2024
37403
IDA & IBRD total
IBT
false
2
1
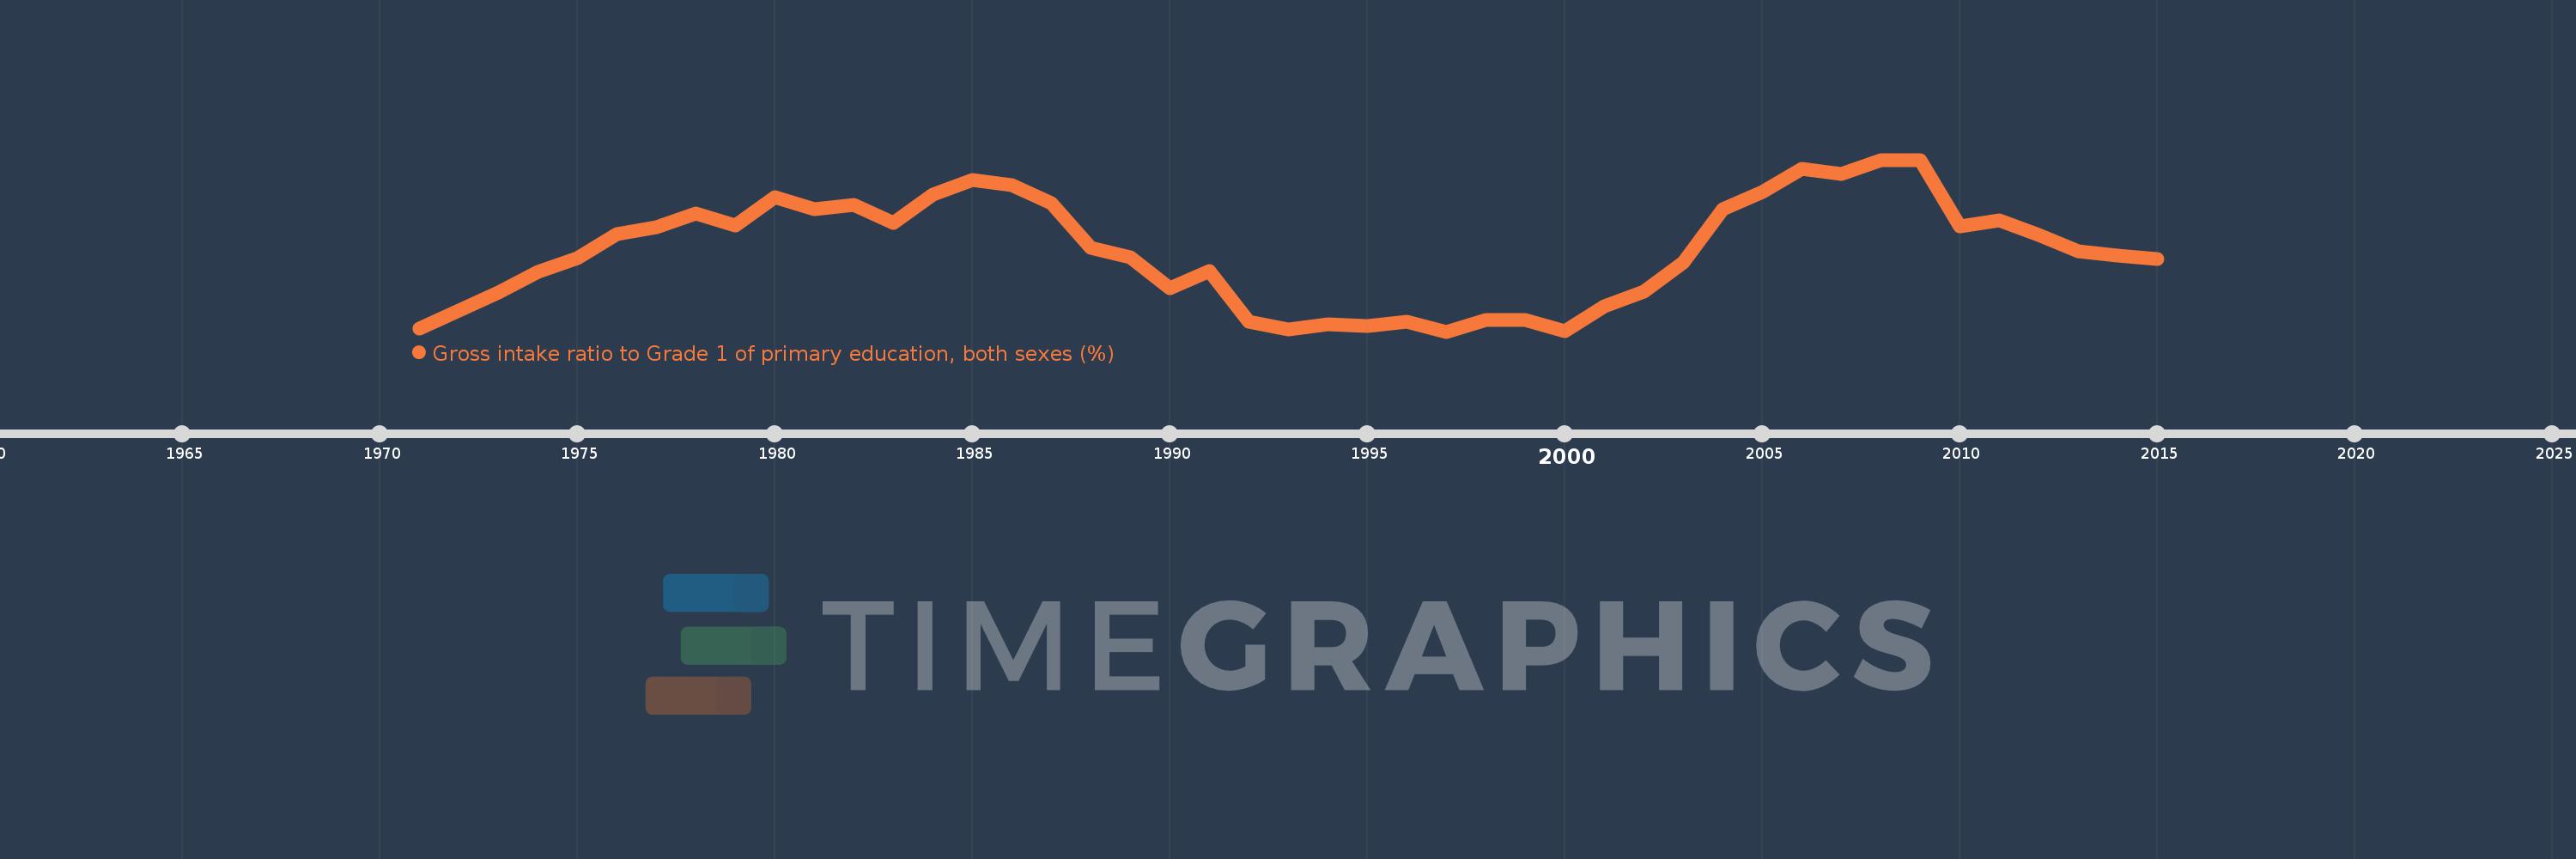
Gross intake ratio to Grade 1 of primary education, both sexes (%)
2015,2014,2013,2012,2011,2010,2009,2008,2007,2006,2005,2004,2003,2002,2001,2000,1999,1998,1997,1996,1995,1994,1993,1992,1991,1990,1989,1988,1987,1986,1985,1984,1983,1982,1981,1980,1979,1978,1977,1976,1975,1974,1973,1972,1971
This statistics in other country:
AfghanistanAlbaniaAlgeriaAngolaAntigua and BarbudaArab WorldArgentinaArmeniaArubaAustriaAzerbaijanBahamas, TheBahrainBangladeshBarbadosBelarusBelgiumBelizeBeninBermudaBhutanBoliviaBosnia and HerzegovinaBotswanaBrazilBritish Virgin IslandsBrunei DarussalamBulgariaBurkina FasoBurundiCabo VerdeCambodiaCameroonCanadaCaribbean small statesCentral African RepublicCentral Europe and the BalticsChadChileChinaColombiaComorosCongo, Dem. Rep.Congo, Rep.Costa RicaCote d'IvoireCroatiaCubaCyprusCzech RepublicDenmarkDjiboutiDominicaDominican RepublicEarly-demographic dividendEast Asia & PacificEast Asia & Pacific (excluding high income)East Asia & Pacific (IDA & IBRD countries)EcuadorEgypt, Arab Rep.El SalvadorEquatorial GuineaEritreaEstoniaEthiopiaEuro areaEurope & Central AsiaEurope & Central Asia (excluding high income)Europe & Central Asia (IDA & IBRD countries)European UnionFijiFinlandFragile and conflict affected situationsFranceGabonGambia, TheGeorgiaGermanyGhanaGreeceGrenadaGuatemalaGuineaGuinea-BissauGuyanaHaitiHeavily indebted poor countries (HIPC)High incomeHondurasHong Kong SAR, ChinaHungaryIBRD onlyIcelandIDA & IBRD totalIDA blendIDA onlyIDA totalIndiaIndonesiaIran, Islamic Rep.IraqIrelandIsraelItalyJamaicaJapanJordanKazakhstanKenyaKiribatiKorea, Dem. People’s Rep.Korea, Rep.KuwaitKyrgyz RepublicLao PDRLate-demographic dividendLatin America & Caribbean Latin America & Caribbean (excluding high income)Latin America & the Caribbean (IDA & IBRD countries)LatviaLeast developed countries: UN classificationLebanonLesothoLiberiaLibyaLiechtensteinLithuaniaLow & middle incomeLow incomeLower middle incomeLuxembourgMacao SAR, ChinaMacedonia, FYRMadagascarMalawiMalaysiaMaldivesMaliMaltaMarshall IslandsMauritaniaMauritiusMexicoMicronesia, Fed. Sts.Middle East & North AfricaMiddle East & North Africa (excluding high income)Middle East & North Africa (IDA & IBRD countries)Middle incomeMoldovaMongoliaMontenegroMoroccoMozambiqueMyanmarNamibiaNauruNepalNetherlandsNew ZealandNicaraguaNigerNigeriaNorth AmericaNorwayOECD membersOmanOther small statesPacific island small statesPakistanPalauPanamaPapua New GuineaParaguayPeruPhilippinesPolandPortugalPost-demographic dividendPre-demographic dividendPuerto RicoQatarRomaniaRussian FederationRwandaSamoaSan MarinoSao Tome and PrincipeSaudi ArabiaSenegalSerbiaSeychellesSierra LeoneSlovak RepublicSloveniaSmall statesSolomon IslandsSouth AfricaSouth AsiaSouth Asia (IDA & IBRD)South SudanSpainSri LankaSt. Kitts and NevisSt. LuciaSt. Vincent and the GrenadinesSub-Saharan Africa Sub-Saharan Africa (excluding high income)Sub-Saharan Africa (IDA & IBRD countries)SudanSurinameSwazilandSwedenSwitzerlandSyrian Arab RepublicTajikistanTanzaniaThailandTimor-LesteTogoTongaTrinidad and TobagoTunisiaTurkeyTuvaluUgandaUkraineUnited Arab EmiratesUnited StatesUpper middle incomeUruguayUzbekistanVanuatuVenezuela, RBVietnamWest Bank and GazaWorldYemen, Rep.ZambiaZimbabwe Timeline:
This timeline shows a graph from 1971 to 2015 of IDA & IBRD total. No data until 1970. Number of actual observations by date: 45.
Source name:
World Development Indicators
Source organization:
UNESCO Institute for Statistics
Categories, topics:
Education
Last updated:
apr 23, 2017
Indicators value changes by year
Minimum:
104.407
jan 1, 1997
Maximum:
115.282
jan 1, 2009
At the date of observation
Value
Absolute change
Change from previous value
jan 1, 1971
104.6
+104.6
0.0%
jan 1, 1972
105.739
+1.139
1.09%
jan 1, 1973
106.886
+1.147
1.08%
jan 1, 1974
108.181
+1.295
1.21%
jan 1, 1975
109.03
+0.85
0.79%
jan 1, 1976
110.558
+1.528
1.4%
jan 1, 1977
111.038
+0.48
0.43%
jan 1, 1978
111.862
+0.824
0.74%
jan 1, 1979
111.101
-0.762
-0.68%
jan 1, 1980
112.928
+1.827
1.64%
jan 1, 1981
112.129
-0.799
-0.71%
jan 1, 1982
112.428
+0.299
0.27%
jan 1, 1983
111.299
-1.129
-1.0%
jan 1, 1984
113.063
+1.764
1.58%
jan 1, 1985
113.979
+0.916
0.81%
jan 1, 1986
113.7
-0.278
-0.24%
jan 1, 1987
112.526
-1.174
-1.03%
jan 1, 1988
109.706
-2.82
-2.51%
jan 1, 1989
109.112
-0.594
-0.54%
jan 1, 1990
107.171
-1.941
-1.78%
jan 1, 1991
108.234
+1.063
0.99%
jan 1, 1992
105.05
-3.183
-2.94%
jan 1, 1993
104.568
-0.483
-0.46%
jan 1, 1994
104.888
+0.321
0.31%
jan 1, 1995
104.782
-0.106
-0.1%
jan 1, 1996
105.04
+0.258
0.25%
jan 1, 1997
104.407
-0.633
-0.6%
jan 1, 1998
105.114
+0.707
0.68%
jan 1, 1999
105.136
+0.022
0.02%
jan 1, 2000
104.443
-0.693
-0.66%
jan 1, 2001
106.034
+1.591
1.52%
jan 1, 2002
106.95
+0.915
0.86%
jan 1, 2003
108.799
+1.849
1.73%
jan 1, 2004
112.161
+3.362
3.09%
jan 1, 2005
113.268
+1.107
0.99%
jan 1, 2006
114.729
+1.46
1.29%
jan 1, 2007
114.404
-0.325
-0.28%
jan 1, 2008
115.272
+0.869
0.76%
jan 1, 2009
115.282
+0.009
0.01%
jan 1, 2010
111.054
-4.228
-3.67%
jan 1, 2011
111.443
+0.389
0.35%
jan 1, 2012
110.529
-0.914
-0.82%
jan 1, 2013
109.491
-1.038
-0.94%
jan 1, 2014
109.233
-0.258
-0.24%
jan 1, 2015
108.977
-0.256
-0.23%
Ranking of countries by current statistics by years


Comments: