29
/
en
AIzaSyAYiBZKx7MnpbEhh9jyipgxe19OcubqV5w
April 1, 2024
40752
Late-demographic dividend
LTE
false
2
1
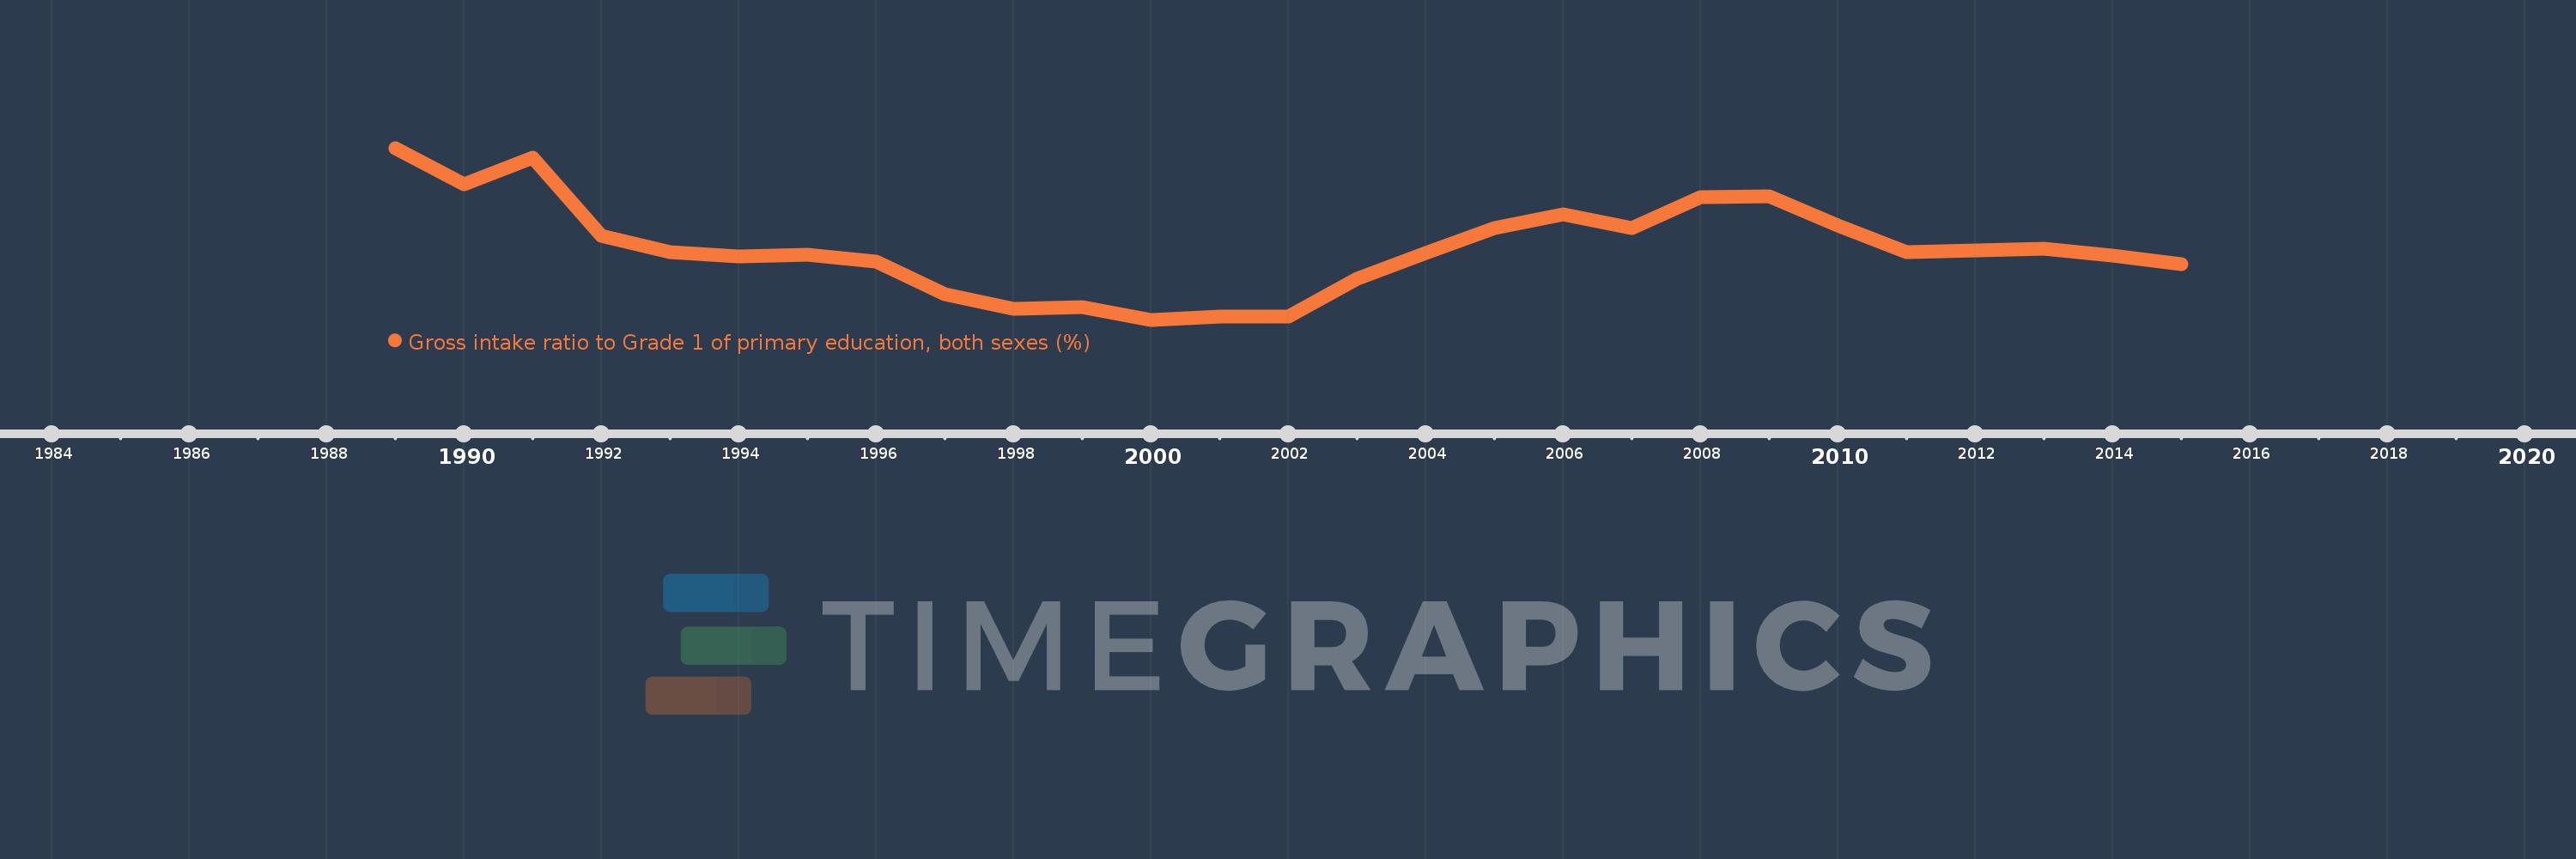
Gross intake ratio to Grade 1 of primary education, both sexes (%)
2015,2014,2013,2012,2011,2010,2009,2008,2007,2006,2005,2004,2003,2002,2001,2000,1999,1998,1997,1996,1995,1994,1993,1992,1991,1990,1989
This statistics in other country:
AfghanistanAlbaniaAlgeriaAngolaAntigua and BarbudaArab WorldArgentinaArmeniaArubaAustriaAzerbaijanBahamas, TheBahrainBangladeshBarbadosBelarusBelgiumBelizeBeninBermudaBhutanBoliviaBosnia and HerzegovinaBotswanaBrazilBritish Virgin IslandsBrunei DarussalamBulgariaBurkina FasoBurundiCabo VerdeCambodiaCameroonCanadaCaribbean small statesCentral African RepublicCentral Europe and the BalticsChadChileChinaColombiaComorosCongo, Dem. Rep.Congo, Rep.Costa RicaCote d'IvoireCroatiaCubaCyprusCzech RepublicDenmarkDjiboutiDominicaDominican RepublicEarly-demographic dividendEast Asia & PacificEast Asia & Pacific (excluding high income)East Asia & Pacific (IDA & IBRD countries)EcuadorEgypt, Arab Rep.El SalvadorEquatorial GuineaEritreaEstoniaEthiopiaEuro areaEurope & Central AsiaEurope & Central Asia (excluding high income)Europe & Central Asia (IDA & IBRD countries)European UnionFijiFinlandFragile and conflict affected situationsFranceGabonGambia, TheGeorgiaGermanyGhanaGreeceGrenadaGuatemalaGuineaGuinea-BissauGuyanaHaitiHeavily indebted poor countries (HIPC)High incomeHondurasHong Kong SAR, ChinaHungaryIBRD onlyIcelandIDA & IBRD totalIDA blendIDA onlyIDA totalIndiaIndonesiaIran, Islamic Rep.IraqIrelandIsraelItalyJamaicaJapanJordanKazakhstanKenyaKiribatiKorea, Dem. People’s Rep.Korea, Rep.KuwaitKyrgyz RepublicLao PDRLate-demographic dividendLatin America & Caribbean Latin America & Caribbean (excluding high income)Latin America & the Caribbean (IDA & IBRD countries)LatviaLeast developed countries: UN classificationLebanonLesothoLiberiaLibyaLiechtensteinLithuaniaLow & middle incomeLow incomeLower middle incomeLuxembourgMacao SAR, ChinaMacedonia, FYRMadagascarMalawiMalaysiaMaldivesMaliMaltaMarshall IslandsMauritaniaMauritiusMexicoMicronesia, Fed. Sts.Middle East & North AfricaMiddle East & North Africa (excluding high income)Middle East & North Africa (IDA & IBRD countries)Middle incomeMoldovaMongoliaMontenegroMoroccoMozambiqueMyanmarNamibiaNauruNepalNetherlandsNew ZealandNicaraguaNigerNigeriaNorth AmericaNorwayOECD membersOmanOther small statesPacific island small statesPakistanPalauPanamaPapua New GuineaParaguayPeruPhilippinesPolandPortugalPost-demographic dividendPre-demographic dividendPuerto RicoQatarRomaniaRussian FederationRwandaSamoaSan MarinoSao Tome and PrincipeSaudi ArabiaSenegalSerbiaSeychellesSierra LeoneSlovak RepublicSloveniaSmall statesSolomon IslandsSouth AfricaSouth AsiaSouth Asia (IDA & IBRD)South SudanSpainSri LankaSt. Kitts and NevisSt. LuciaSt. Vincent and the GrenadinesSub-Saharan Africa Sub-Saharan Africa (excluding high income)Sub-Saharan Africa (IDA & IBRD countries)SudanSurinameSwazilandSwedenSwitzerlandSyrian Arab RepublicTajikistanTanzaniaThailandTimor-LesteTogoTongaTrinidad and TobagoTunisiaTurkeyTuvaluUgandaUkraineUnited Arab EmiratesUnited StatesUpper middle incomeUruguayUzbekistanVanuatuVenezuela, RBVietnamWest Bank and GazaWorldYemen, Rep.ZambiaZimbabwe Timeline:
This timeline shows a graph from 1989 to 2015 of Late-demographic dividend. No data until 1988. Number of actual observations by date: 27.
Source name:
World Development Indicators
Source organization:
UNESCO Institute for Statistics
Categories, topics:
Education
Last updated:
apr 23, 2017
Indicators value changes by year
Minimum:
97.133
jan 1, 2000
Maximum:
118.096
jan 1, 1989
At the date of observation
Value
Absolute change
Change from previous value
jan 1, 1989
118.096
+118.096
0.0%
jan 1, 1990
113.69
-4.406
-3.73%
jan 1, 1991
116.898
+3.208
2.82%
jan 1, 1992
107.347
-9.551
-8.17%
jan 1, 1993
105.349
-1.998
-1.86%
jan 1, 1994
104.901
-0.449
-0.43%
jan 1, 1995
105.113
+0.212
0.2%
jan 1, 1996
104.204
-0.909
-0.86%
jan 1, 1997
100.203
-4.001
-3.84%
jan 1, 1998
98.49
-1.713
-1.71%
jan 1, 1999
98.669
+0.18
0.18%
jan 1, 2000
97.133
-1.536
-1.56%
jan 1, 2001
97.502
+0.369
0.38%
jan 1, 2002
97.501
-0.001
0.0%
jan 1, 2003
102.131
+4.63
4.75%
jan 1, 2004
105.299
+3.168
3.1%
jan 1, 2005
108.317
+3.019
2.87%
jan 1, 2006
110.041
+1.724
1.59%
jan 1, 2007
108.351
-1.691
-1.54%
jan 1, 2008
112.096
+3.745
3.46%
jan 1, 2009
112.198
+0.102
0.09%
jan 1, 2010
108.607
-3.591
-3.2%
jan 1, 2011
105.391
-3.217
-2.96%
jan 1, 2012
105.544
+0.154
0.15%
jan 1, 2013
105.82
+0.275
0.26%
jan 1, 2014
105.014
-0.805
-0.76%
jan 1, 2015
103.965
-1.049
-1.0%
Ranking of countries by current statistics by years


Comments: