29
/
en
AIzaSyAYiBZKx7MnpbEhh9jyipgxe19OcubqV5w
April 1, 2024
29134
East Asia & Pacific (IDA & IBRD countries)
TEA
false
2
1
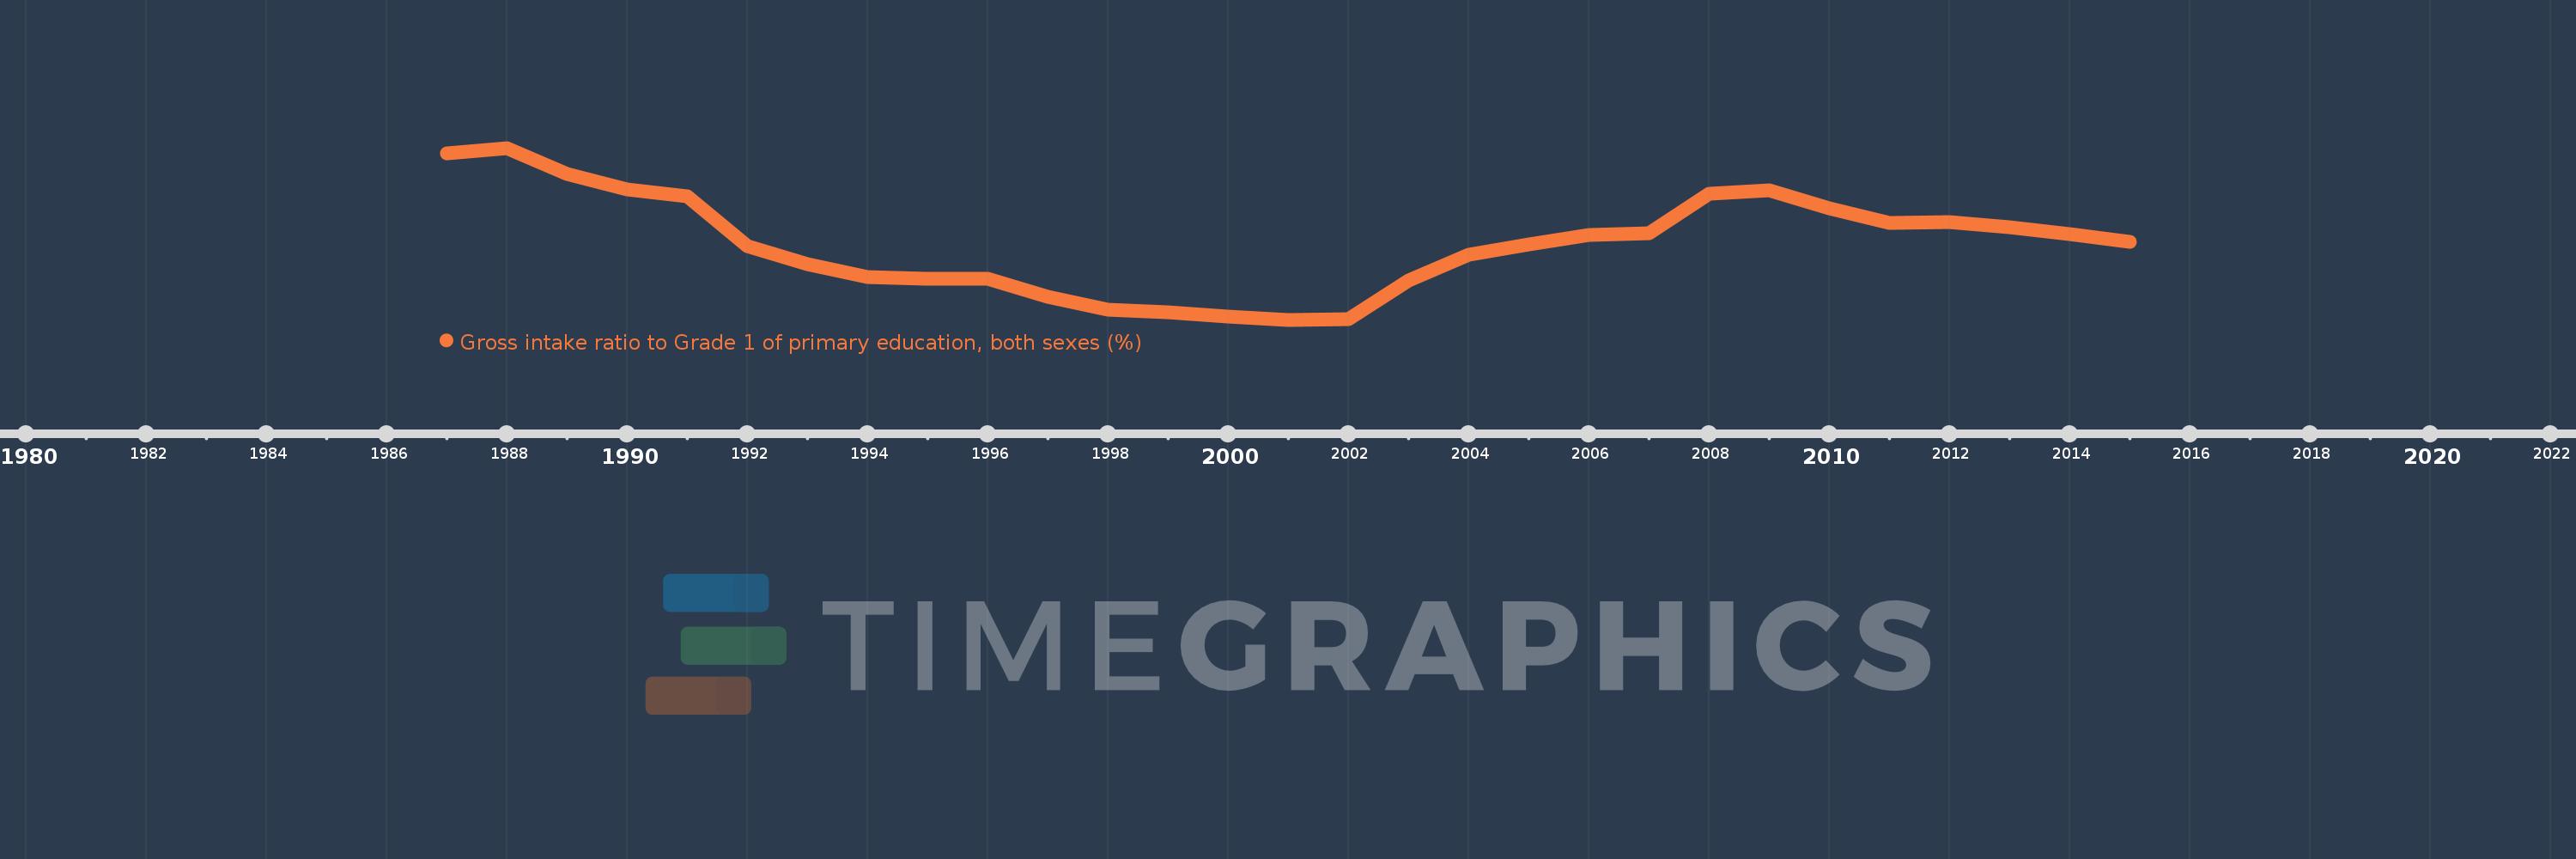
Gross intake ratio to Grade 1 of primary education, both sexes (%)
2015,2014,2013,2012,2011,2010,2009,2008,2007,2006,2005,2004,2003,2002,2001,2000,1999,1998,1997,1996,1995,1994,1993,1992,1991,1990,1989,1988,1987
This statistics in other country:
AfghanistanAlbaniaAlgeriaAngolaAntigua and BarbudaArab WorldArgentinaArmeniaArubaAustriaAzerbaijanBahamas, TheBahrainBangladeshBarbadosBelarusBelgiumBelizeBeninBermudaBhutanBoliviaBosnia and HerzegovinaBotswanaBrazilBritish Virgin IslandsBrunei DarussalamBulgariaBurkina FasoBurundiCabo VerdeCambodiaCameroonCanadaCaribbean small statesCentral African RepublicCentral Europe and the BalticsChadChileChinaColombiaComorosCongo, Dem. Rep.Congo, Rep.Costa RicaCote d'IvoireCroatiaCubaCyprusCzech RepublicDenmarkDjiboutiDominicaDominican RepublicEarly-demographic dividendEast Asia & PacificEast Asia & Pacific (excluding high income)East Asia & Pacific (IDA & IBRD countries)EcuadorEgypt, Arab Rep.El SalvadorEquatorial GuineaEritreaEstoniaEthiopiaEuro areaEurope & Central AsiaEurope & Central Asia (excluding high income)Europe & Central Asia (IDA & IBRD countries)European UnionFijiFinlandFragile and conflict affected situationsFranceGabonGambia, TheGeorgiaGermanyGhanaGreeceGrenadaGuatemalaGuineaGuinea-BissauGuyanaHaitiHeavily indebted poor countries (HIPC)High incomeHondurasHong Kong SAR, ChinaHungaryIBRD onlyIcelandIDA & IBRD totalIDA blendIDA onlyIDA totalIndiaIndonesiaIran, Islamic Rep.IraqIrelandIsraelItalyJamaicaJapanJordanKazakhstanKenyaKiribatiKorea, Dem. People’s Rep.Korea, Rep.KuwaitKyrgyz RepublicLao PDRLate-demographic dividendLatin America & Caribbean Latin America & Caribbean (excluding high income)Latin America & the Caribbean (IDA & IBRD countries)LatviaLeast developed countries: UN classificationLebanonLesothoLiberiaLibyaLiechtensteinLithuaniaLow & middle incomeLow incomeLower middle incomeLuxembourgMacao SAR, ChinaMacedonia, FYRMadagascarMalawiMalaysiaMaldivesMaliMaltaMarshall IslandsMauritaniaMauritiusMexicoMicronesia, Fed. Sts.Middle East & North AfricaMiddle East & North Africa (excluding high income)Middle East & North Africa (IDA & IBRD countries)Middle incomeMoldovaMongoliaMontenegroMoroccoMozambiqueMyanmarNamibiaNauruNepalNetherlandsNew ZealandNicaraguaNigerNigeriaNorth AmericaNorwayOECD membersOmanOther small statesPacific island small statesPakistanPalauPanamaPapua New GuineaParaguayPeruPhilippinesPolandPortugalPost-demographic dividendPre-demographic dividendPuerto RicoQatarRomaniaRussian FederationRwandaSamoaSan MarinoSao Tome and PrincipeSaudi ArabiaSenegalSerbiaSeychellesSierra LeoneSlovak RepublicSloveniaSmall statesSolomon IslandsSouth AfricaSouth AsiaSouth Asia (IDA & IBRD)South SudanSpainSri LankaSt. Kitts and NevisSt. LuciaSt. Vincent and the GrenadinesSub-Saharan Africa Sub-Saharan Africa (excluding high income)Sub-Saharan Africa (IDA & IBRD countries)SudanSurinameSwazilandSwedenSwitzerlandSyrian Arab RepublicTajikistanTanzaniaThailandTimor-LesteTogoTongaTrinidad and TobagoTunisiaTurkeyTuvaluUgandaUkraineUnited Arab EmiratesUnited StatesUpper middle incomeUruguayUzbekistanVanuatuVenezuela, RBVietnamWest Bank and GazaWorldYemen, Rep.ZambiaZimbabwe Timeline:
This timeline shows a graph from 1987 to 2015 of East Asia & Pacific (IDA & IBRD countries). No data until 1986. Number of actual observations by date: 29.
Source name:
World Development Indicators
Source organization:
UNESCO Institute for Statistics
Categories, topics:
Education
Last updated:
apr 23, 2017
Indicators value changes by year
Minimum:
98.404
jan 1, 2001
Maximum:
122.956
jan 1, 1988
At the date of observation
Value
Absolute change
Change from previous value
jan 1, 1987
122.184
+122.184
0.0%
jan 1, 1988
122.956
+0.772
0.63%
jan 1, 1989
119.219
-3.736
-3.04%
jan 1, 1990
117.08
-2.139
-1.79%
jan 1, 1991
115.986
-1.095
-0.93%
jan 1, 1992
108.951
-7.034
-6.06%
jan 1, 1993
106.4
-2.551
-2.34%
jan 1, 1994
104.472
-1.928
-1.81%
jan 1, 1995
104.212
-0.26
-0.25%
jan 1, 1996
104.32
+0.107
0.1%
jan 1, 1997
101.728
-2.591
-2.48%
jan 1, 1998
99.859
-1.869
-1.84%
jan 1, 1999
99.509
-0.349
-0.35%
jan 1, 2000
98.815
-0.694
-0.7%
jan 1, 2001
98.404
-0.411
-0.42%
jan 1, 2002
98.49
+0.086
0.09%
jan 1, 2003
104.009
+5.518
5.6%
jan 1, 2004
107.639
+3.63
3.49%
jan 1, 2005
109.208
+1.57
1.46%
jan 1, 2006
110.523
+1.315
1.2%
jan 1, 2007
110.799
+0.276
0.25%
jan 1, 2008
116.4
+5.601
5.05%
jan 1, 2009
116.939
+0.539
0.46%
jan 1, 2010
114.379
-2.559
-2.19%
jan 1, 2011
112.258
-2.121
-1.85%
jan 1, 2012
112.327
+0.069
0.06%
jan 1, 2013
111.589
-0.738
-0.66%
jan 1, 2014
110.628
-0.961
-0.86%
jan 1, 2015
109.561
-1.067
-0.96%
Ranking of countries by current statistics by years


Comments: