29
/
en
AIzaSyAYiBZKx7MnpbEhh9jyipgxe19OcubqV5w
April 1, 2024
46149
Low income
LIC
false
2
1
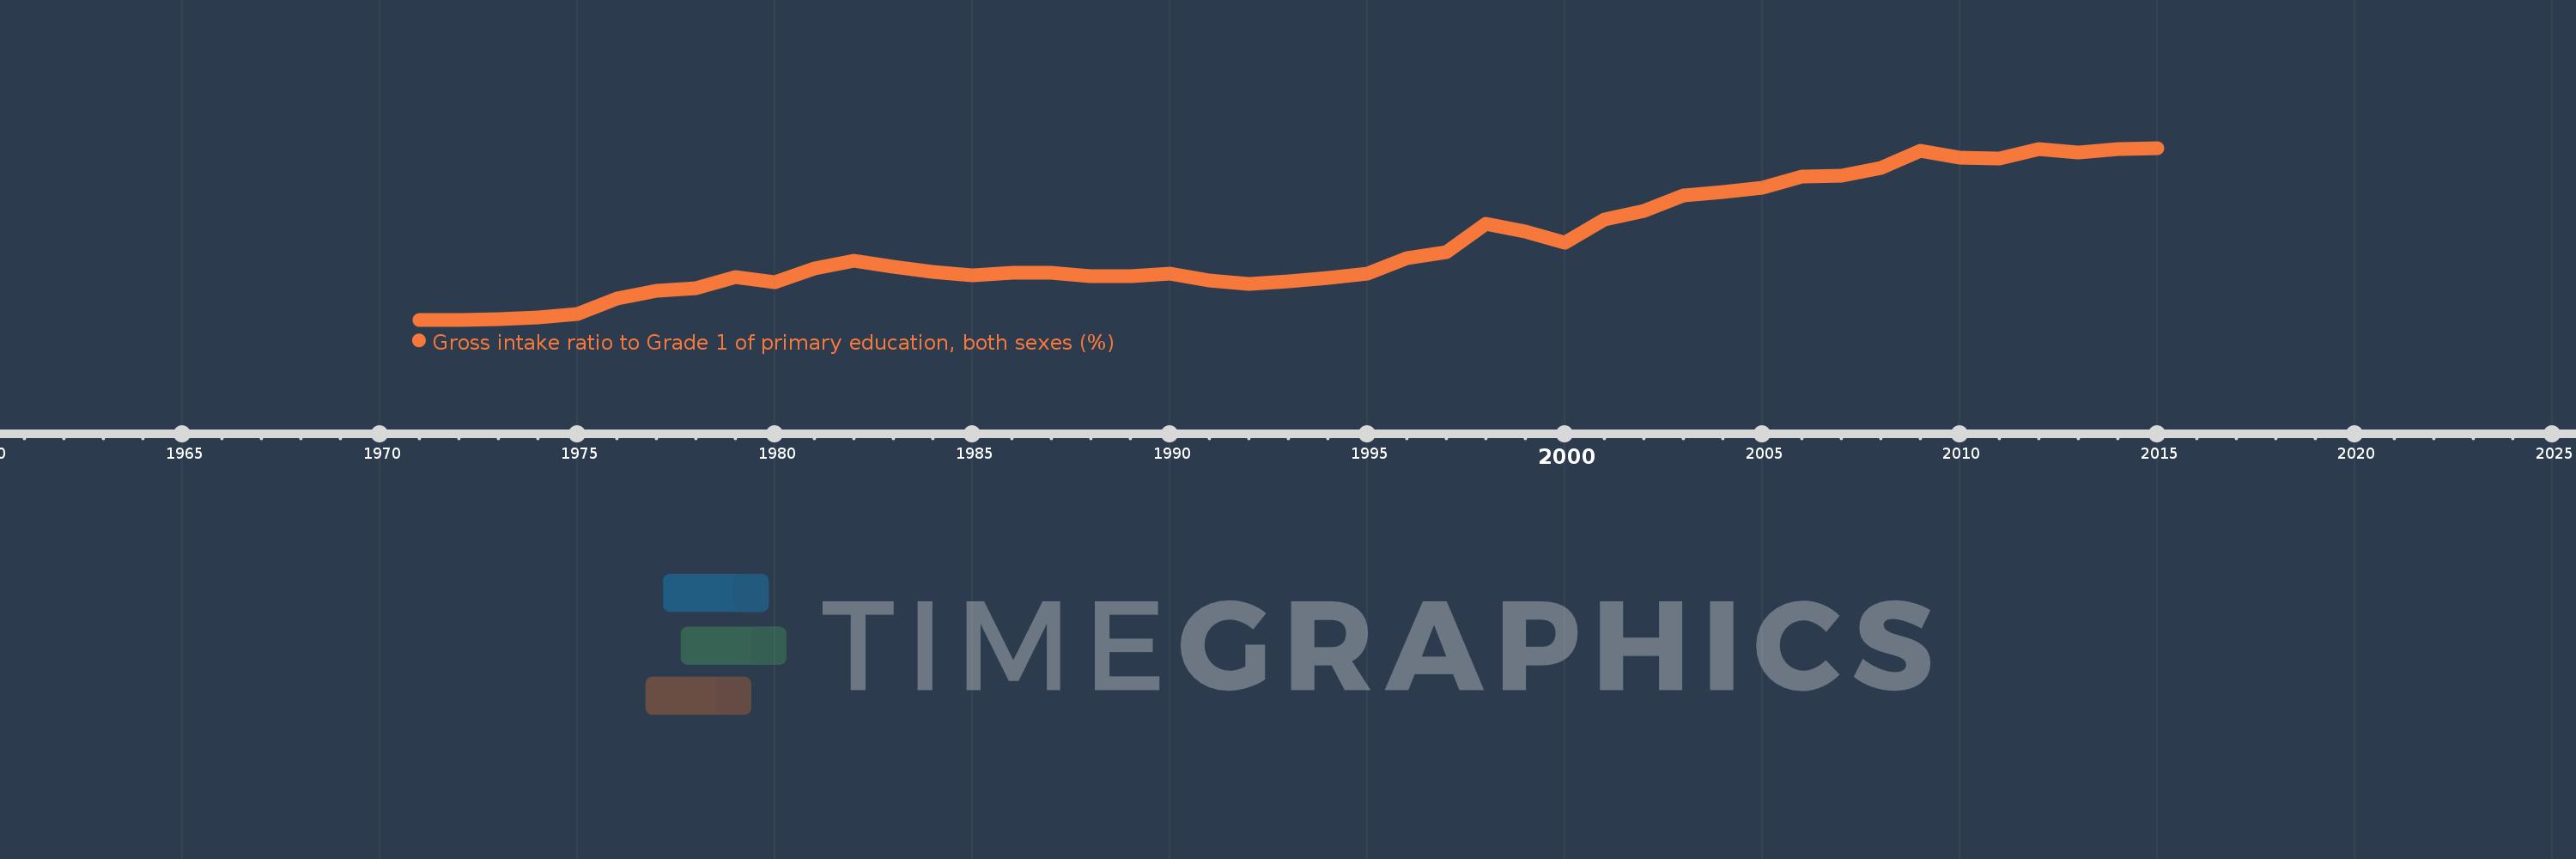
Gross intake ratio to Grade 1 of primary education, both sexes (%)
2015,2014,2013,2012,2011,2010,2009,2008,2007,2006,2005,2004,2003,2002,2001,2000,1999,1998,1997,1996,1995,1994,1993,1992,1991,1990,1989,1988,1987,1986,1985,1984,1983,1982,1981,1980,1979,1978,1977,1976,1975,1974,1973,1972,1971
This statistics in other country:
AfghanistanAlbaniaAlgeriaAngolaAntigua and BarbudaArab WorldArgentinaArmeniaArubaAustriaAzerbaijanBahamas, TheBahrainBangladeshBarbadosBelarusBelgiumBelizeBeninBermudaBhutanBoliviaBosnia and HerzegovinaBotswanaBrazilBritish Virgin IslandsBrunei DarussalamBulgariaBurkina FasoBurundiCabo VerdeCambodiaCameroonCanadaCaribbean small statesCentral African RepublicCentral Europe and the BalticsChadChileChinaColombiaComorosCongo, Dem. Rep.Congo, Rep.Costa RicaCote d'IvoireCroatiaCubaCyprusCzech RepublicDenmarkDjiboutiDominicaDominican RepublicEarly-demographic dividendEast Asia & PacificEast Asia & Pacific (excluding high income)East Asia & Pacific (IDA & IBRD countries)EcuadorEgypt, Arab Rep.El SalvadorEquatorial GuineaEritreaEstoniaEthiopiaEuro areaEurope & Central AsiaEurope & Central Asia (excluding high income)Europe & Central Asia (IDA & IBRD countries)European UnionFijiFinlandFragile and conflict affected situationsFranceGabonGambia, TheGeorgiaGermanyGhanaGreeceGrenadaGuatemalaGuineaGuinea-BissauGuyanaHaitiHeavily indebted poor countries (HIPC)High incomeHondurasHong Kong SAR, ChinaHungaryIBRD onlyIcelandIDA & IBRD totalIDA blendIDA onlyIDA totalIndiaIndonesiaIran, Islamic Rep.IraqIrelandIsraelItalyJamaicaJapanJordanKazakhstanKenyaKiribatiKorea, Dem. People’s Rep.Korea, Rep.KuwaitKyrgyz RepublicLao PDRLate-demographic dividendLatin America & Caribbean Latin America & Caribbean (excluding high income)Latin America & the Caribbean (IDA & IBRD countries)LatviaLeast developed countries: UN classificationLebanonLesothoLiberiaLibyaLiechtensteinLithuaniaLow & middle incomeLow incomeLower middle incomeLuxembourgMacao SAR, ChinaMacedonia, FYRMadagascarMalawiMalaysiaMaldivesMaliMaltaMarshall IslandsMauritaniaMauritiusMexicoMicronesia, Fed. Sts.Middle East & North AfricaMiddle East & North Africa (excluding high income)Middle East & North Africa (IDA & IBRD countries)Middle incomeMoldovaMongoliaMontenegroMoroccoMozambiqueMyanmarNamibiaNauruNepalNetherlandsNew ZealandNicaraguaNigerNigeriaNorth AmericaNorwayOECD membersOmanOther small statesPacific island small statesPakistanPalauPanamaPapua New GuineaParaguayPeruPhilippinesPolandPortugalPost-demographic dividendPre-demographic dividendPuerto RicoQatarRomaniaRussian FederationRwandaSamoaSan MarinoSao Tome and PrincipeSaudi ArabiaSenegalSerbiaSeychellesSierra LeoneSlovak RepublicSloveniaSmall statesSolomon IslandsSouth AfricaSouth AsiaSouth Asia (IDA & IBRD)South SudanSpainSri LankaSt. Kitts and NevisSt. LuciaSt. Vincent and the GrenadinesSub-Saharan Africa Sub-Saharan Africa (excluding high income)Sub-Saharan Africa (IDA & IBRD countries)SudanSurinameSwazilandSwedenSwitzerlandSyrian Arab RepublicTajikistanTanzaniaThailandTimor-LesteTogoTongaTrinidad and TobagoTunisiaTurkeyTuvaluUgandaUkraineUnited Arab EmiratesUnited StatesUpper middle incomeUruguayUzbekistanVanuatuVenezuela, RBVietnamWest Bank and GazaWorldYemen, Rep.ZambiaZimbabwe Timeline:
This timeline shows a graph from 1971 to 2015 of Low income. No data until 1970. Number of actual observations by date: 45.
Source name:
World Development Indicators
Source organization:
UNESCO Institute for Statistics
Categories, topics:
Education
Last updated:
apr 23, 2017
Indicators value changes by year
Minimum:
58.573
jan 1, 1972
Maximum:
127.892
jan 1, 2015
At the date of observation
Value
Absolute change
Change from previous value
jan 1, 1971
58.611
+58.611
0.0%
jan 1, 1972
58.573
-0.038
-0.06%
jan 1, 1973
58.959
+0.386
0.66%
jan 1, 1974
59.452
+0.493
0.84%
jan 1, 1975
60.889
+1.437
2.42%
jan 1, 1976
66.974
+6.085
9.99%
jan 1, 1977
70.2
+3.226
4.82%
jan 1, 1978
71.159
+0.959
1.37%
jan 1, 1979
75.675
+4.516
6.35%
jan 1, 1980
73.756
-1.919
-2.54%
jan 1, 1981
79.098
+5.342
7.24%
jan 1, 1982
82.236
+3.138
3.97%
jan 1, 1983
79.886
-2.35
-2.86%
jan 1, 1984
78.014
-1.872
-2.34%
jan 1, 1985
76.501
-1.513
-1.94%
jan 1, 1986
77.584
+1.083
1.42%
jan 1, 1987
77.529
-0.055
-0.07%
jan 1, 1988
76.015
-1.513
-1.95%
jan 1, 1989
76.08
+0.064
0.08%
jan 1, 1990
77.081
+1.001
1.32%
jan 1, 1991
74.296
-2.785
-3.61%
jan 1, 1992
73.107
-1.189
-1.6%
jan 1, 1993
74.147
+1.04
1.42%
jan 1, 1994
75.371
+1.224
1.65%
jan 1, 1995
77.19
+1.818
2.41%
jan 1, 1996
83.53
+6.341
8.21%
jan 1, 1997
85.917
+2.387
2.86%
jan 1, 1998
97.355
+11.438
13.31%
jan 1, 1999
94.316
-3.039
-3.12%
jan 1, 2000
89.654
-4.662
-4.94%
jan 1, 2001
98.992
+9.339
10.42%
jan 1, 2002
102.507
+3.515
3.55%
jan 1, 2003
108.848
+6.341
6.19%
jan 1, 2004
110.043
+1.195
1.1%
jan 1, 2005
111.966
+1.923
1.75%
jan 1, 2006
116.372
+4.406
3.94%
jan 1, 2007
116.618
+0.246
0.21%
jan 1, 2008
119.834
+3.216
2.76%
jan 1, 2009
126.818
+6.984
5.83%
jan 1, 2010
123.811
-3.007
-2.37%
jan 1, 2011
123.66
-0.151
-0.12%
jan 1, 2012
127.493
+3.833
3.1%
jan 1, 2013
126.14
-1.354
-1.06%
jan 1, 2014
127.311
+1.171
0.93%
jan 1, 2015
127.892
+0.581
0.46%
Ranking of countries by current statistics by years


Comments: