29
/
en
AIzaSyAYiBZKx7MnpbEhh9jyipgxe19OcubqV5w
April 1, 2024
31634
Europe & Central Asia (excluding high income)
ECA
false
2
1
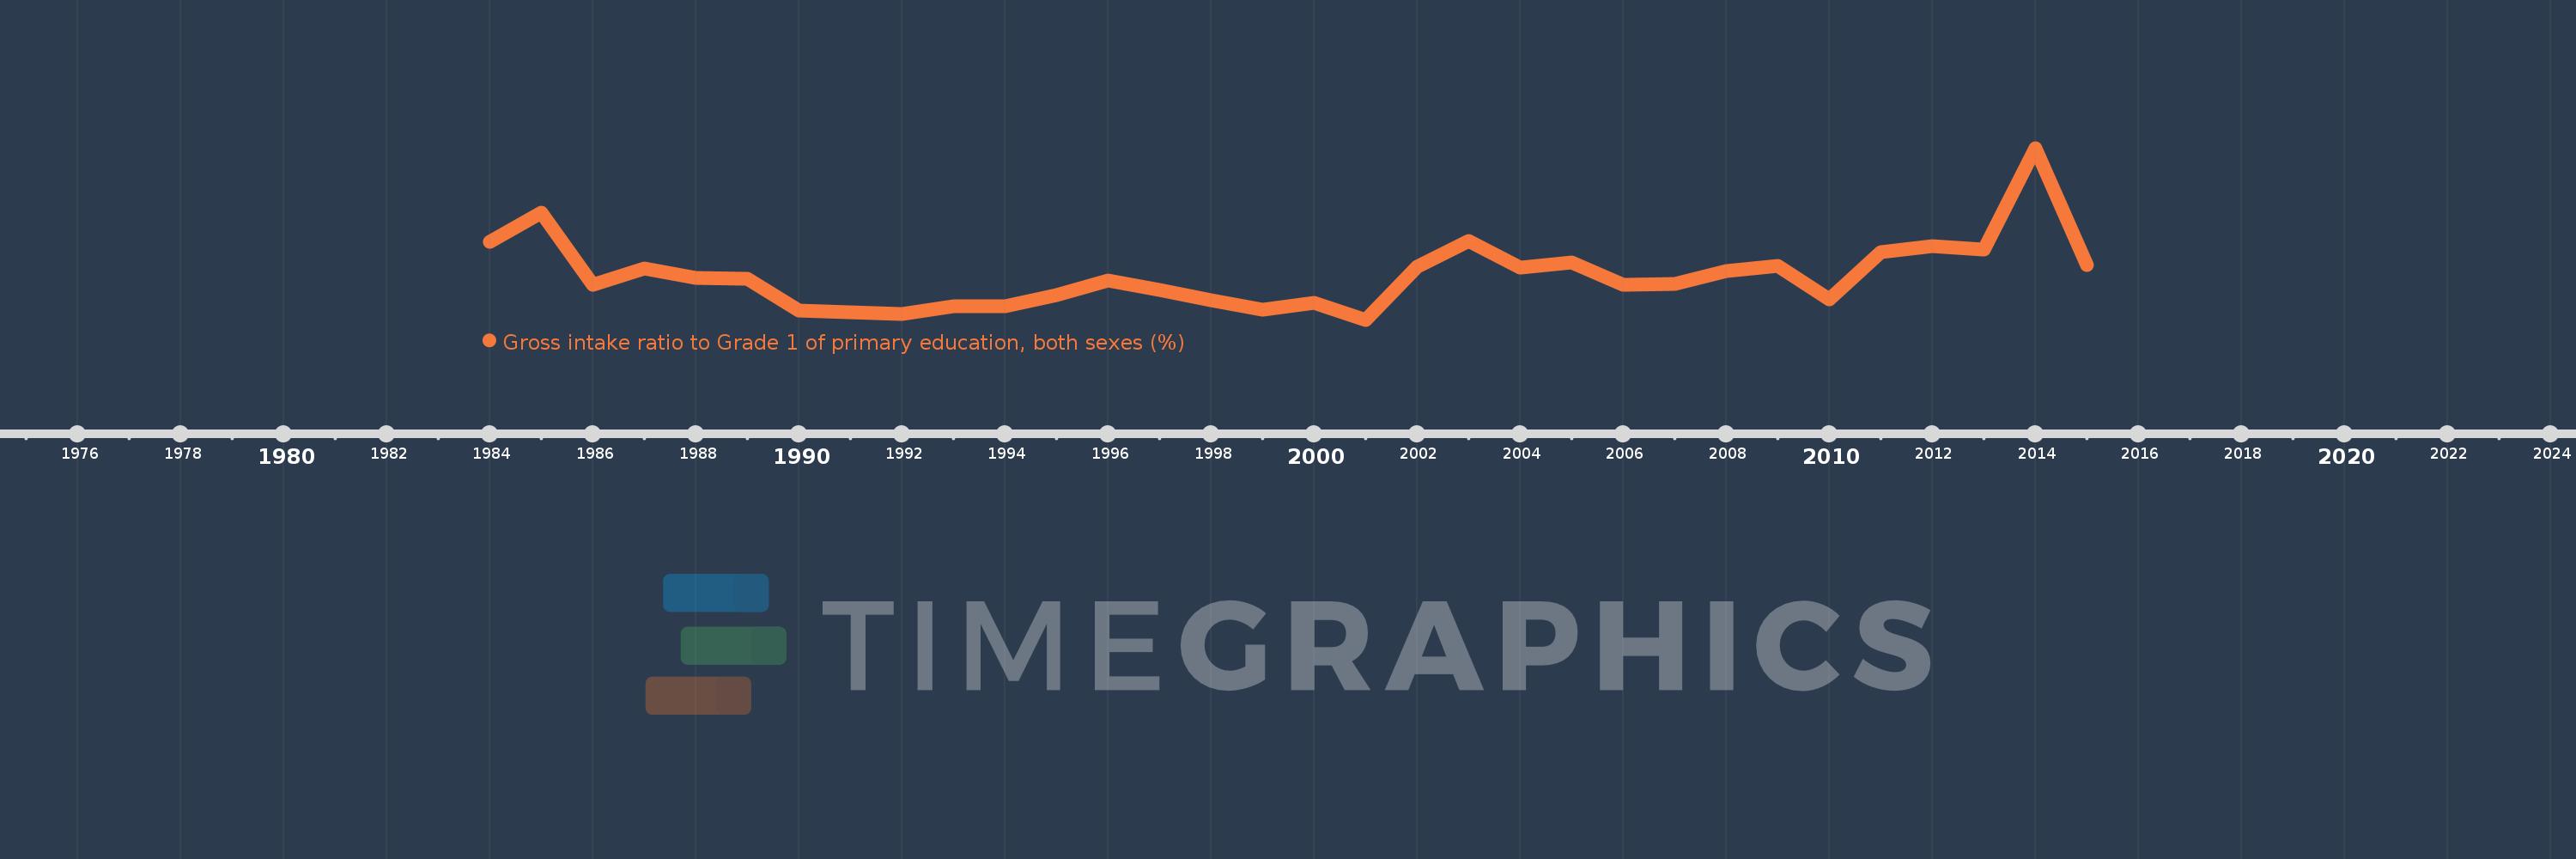
Gross intake ratio to Grade 1 of primary education, both sexes (%)
2015,2014,2013,2012,2011,2010,2009,2008,2007,2006,2005,2004,2003,2002,2001,2000,1999,1998,1997,1996,1995,1994,1993,1992,1991,1990,1989,1988,1987,1986,1985,1984
This statistics in other country:
AfghanistanAlbaniaAlgeriaAngolaAntigua and BarbudaArab WorldArgentinaArmeniaArubaAustriaAzerbaijanBahamas, TheBahrainBangladeshBarbadosBelarusBelgiumBelizeBeninBermudaBhutanBoliviaBosnia and HerzegovinaBotswanaBrazilBritish Virgin IslandsBrunei DarussalamBulgariaBurkina FasoBurundiCabo VerdeCambodiaCameroonCanadaCaribbean small statesCentral African RepublicCentral Europe and the BalticsChadChileChinaColombiaComorosCongo, Dem. Rep.Congo, Rep.Costa RicaCote d'IvoireCroatiaCubaCyprusCzech RepublicDenmarkDjiboutiDominicaDominican RepublicEarly-demographic dividendEast Asia & PacificEast Asia & Pacific (excluding high income)East Asia & Pacific (IDA & IBRD countries)EcuadorEgypt, Arab Rep.El SalvadorEquatorial GuineaEritreaEstoniaEthiopiaEuro areaEurope & Central AsiaEurope & Central Asia (excluding high income)Europe & Central Asia (IDA & IBRD countries)European UnionFijiFinlandFragile and conflict affected situationsFranceGabonGambia, TheGeorgiaGermanyGhanaGreeceGrenadaGuatemalaGuineaGuinea-BissauGuyanaHaitiHeavily indebted poor countries (HIPC)High incomeHondurasHong Kong SAR, ChinaHungaryIBRD onlyIcelandIDA & IBRD totalIDA blendIDA onlyIDA totalIndiaIndonesiaIran, Islamic Rep.IraqIrelandIsraelItalyJamaicaJapanJordanKazakhstanKenyaKiribatiKorea, Dem. People’s Rep.Korea, Rep.KuwaitKyrgyz RepublicLao PDRLate-demographic dividendLatin America & Caribbean Latin America & Caribbean (excluding high income)Latin America & the Caribbean (IDA & IBRD countries)LatviaLeast developed countries: UN classificationLebanonLesothoLiberiaLibyaLiechtensteinLithuaniaLow & middle incomeLow incomeLower middle incomeLuxembourgMacao SAR, ChinaMacedonia, FYRMadagascarMalawiMalaysiaMaldivesMaliMaltaMarshall IslandsMauritaniaMauritiusMexicoMicronesia, Fed. Sts.Middle East & North AfricaMiddle East & North Africa (excluding high income)Middle East & North Africa (IDA & IBRD countries)Middle incomeMoldovaMongoliaMontenegroMoroccoMozambiqueMyanmarNamibiaNauruNepalNetherlandsNew ZealandNicaraguaNigerNigeriaNorth AmericaNorwayOECD membersOmanOther small statesPacific island small statesPakistanPalauPanamaPapua New GuineaParaguayPeruPhilippinesPolandPortugalPost-demographic dividendPre-demographic dividendPuerto RicoQatarRomaniaRussian FederationRwandaSamoaSan MarinoSao Tome and PrincipeSaudi ArabiaSenegalSerbiaSeychellesSierra LeoneSlovak RepublicSloveniaSmall statesSolomon IslandsSouth AfricaSouth AsiaSouth Asia (IDA & IBRD)South SudanSpainSri LankaSt. Kitts and NevisSt. LuciaSt. Vincent and the GrenadinesSub-Saharan Africa Sub-Saharan Africa (excluding high income)Sub-Saharan Africa (IDA & IBRD countries)SudanSurinameSwazilandSwedenSwitzerlandSyrian Arab RepublicTajikistanTanzaniaThailandTimor-LesteTogoTongaTrinidad and TobagoTunisiaTurkeyTuvaluUgandaUkraineUnited Arab EmiratesUnited StatesUpper middle incomeUruguayUzbekistanVanuatuVenezuela, RBVietnamWest Bank and GazaWorldYemen, Rep.ZambiaZimbabwe Timeline:
This timeline shows a graph from 1984 to 2015 of Europe & Central Asia (excluding high income). No data until 1983. Number of actual observations by date: 32.
Source name:
World Development Indicators
Source organization:
UNESCO Institute for Statistics
Categories, topics:
Education
Last updated:
apr 23, 2017
Indicators value changes by year
Minimum:
97.098
jan 1, 2001
Maximum:
109.74
jan 1, 2014
At the date of observation
Value
Absolute change
Change from previous value
jan 1, 1984
102.843
+102.843
0.0%
jan 1, 1985
104.983
+2.14
2.08%
jan 1, 1986
99.656
-5.328
-5.07%
jan 1, 1987
100.881
+1.225
1.23%
jan 1, 1988
100.183
-0.697
-0.69%
jan 1, 1989
100.108
-0.075
-0.07%
jan 1, 1990
97.759
-2.349
-2.35%
jan 1, 1991
97.676
-0.083
-0.09%
jan 1, 1992
97.553
-0.123
-0.13%
jan 1, 1993
98.116
+0.563
0.58%
jan 1, 1994
98.062
-0.055
-0.06%
jan 1, 1995
98.917
+0.856
0.87%
jan 1, 1996
100.018
+1.1
1.11%
jan 1, 1997
99.298
-0.719
-0.72%
jan 1, 1998
98.522
-0.776
-0.78%
jan 1, 1999
97.854
-0.668
-0.68%
jan 1, 2000
98.318
+0.464
0.47%
jan 1, 2001
97.098
-1.221
-1.24%
jan 1, 2002
100.975
+3.877
3.99%
jan 1, 2003
102.899
+1.924
1.91%
jan 1, 2004
100.956
-1.943
-1.89%
jan 1, 2005
101.303
+0.348
0.34%
jan 1, 2006
99.682
-1.621
-1.6%
jan 1, 2007
99.733
+0.051
0.05%
jan 1, 2008
100.694
+0.961
0.96%
jan 1, 2009
101.057
+0.364
0.36%
jan 1, 2010
98.618
-2.44
-2.41%
jan 1, 2011
102.046
+3.428
3.48%
jan 1, 2012
102.492
+0.446
0.44%
jan 1, 2013
102.274
-0.218
-0.21%
jan 1, 2014
109.74
+7.466
7.3%
jan 1, 2015
101.147
-8.593
-7.83%
Ranking of countries by current statistics by years


Comments: