29
/
en
AIzaSyAYiBZKx7MnpbEhh9jyipgxe19OcubqV5w
April 1, 2024
224913
Poland
POL
true
2
1
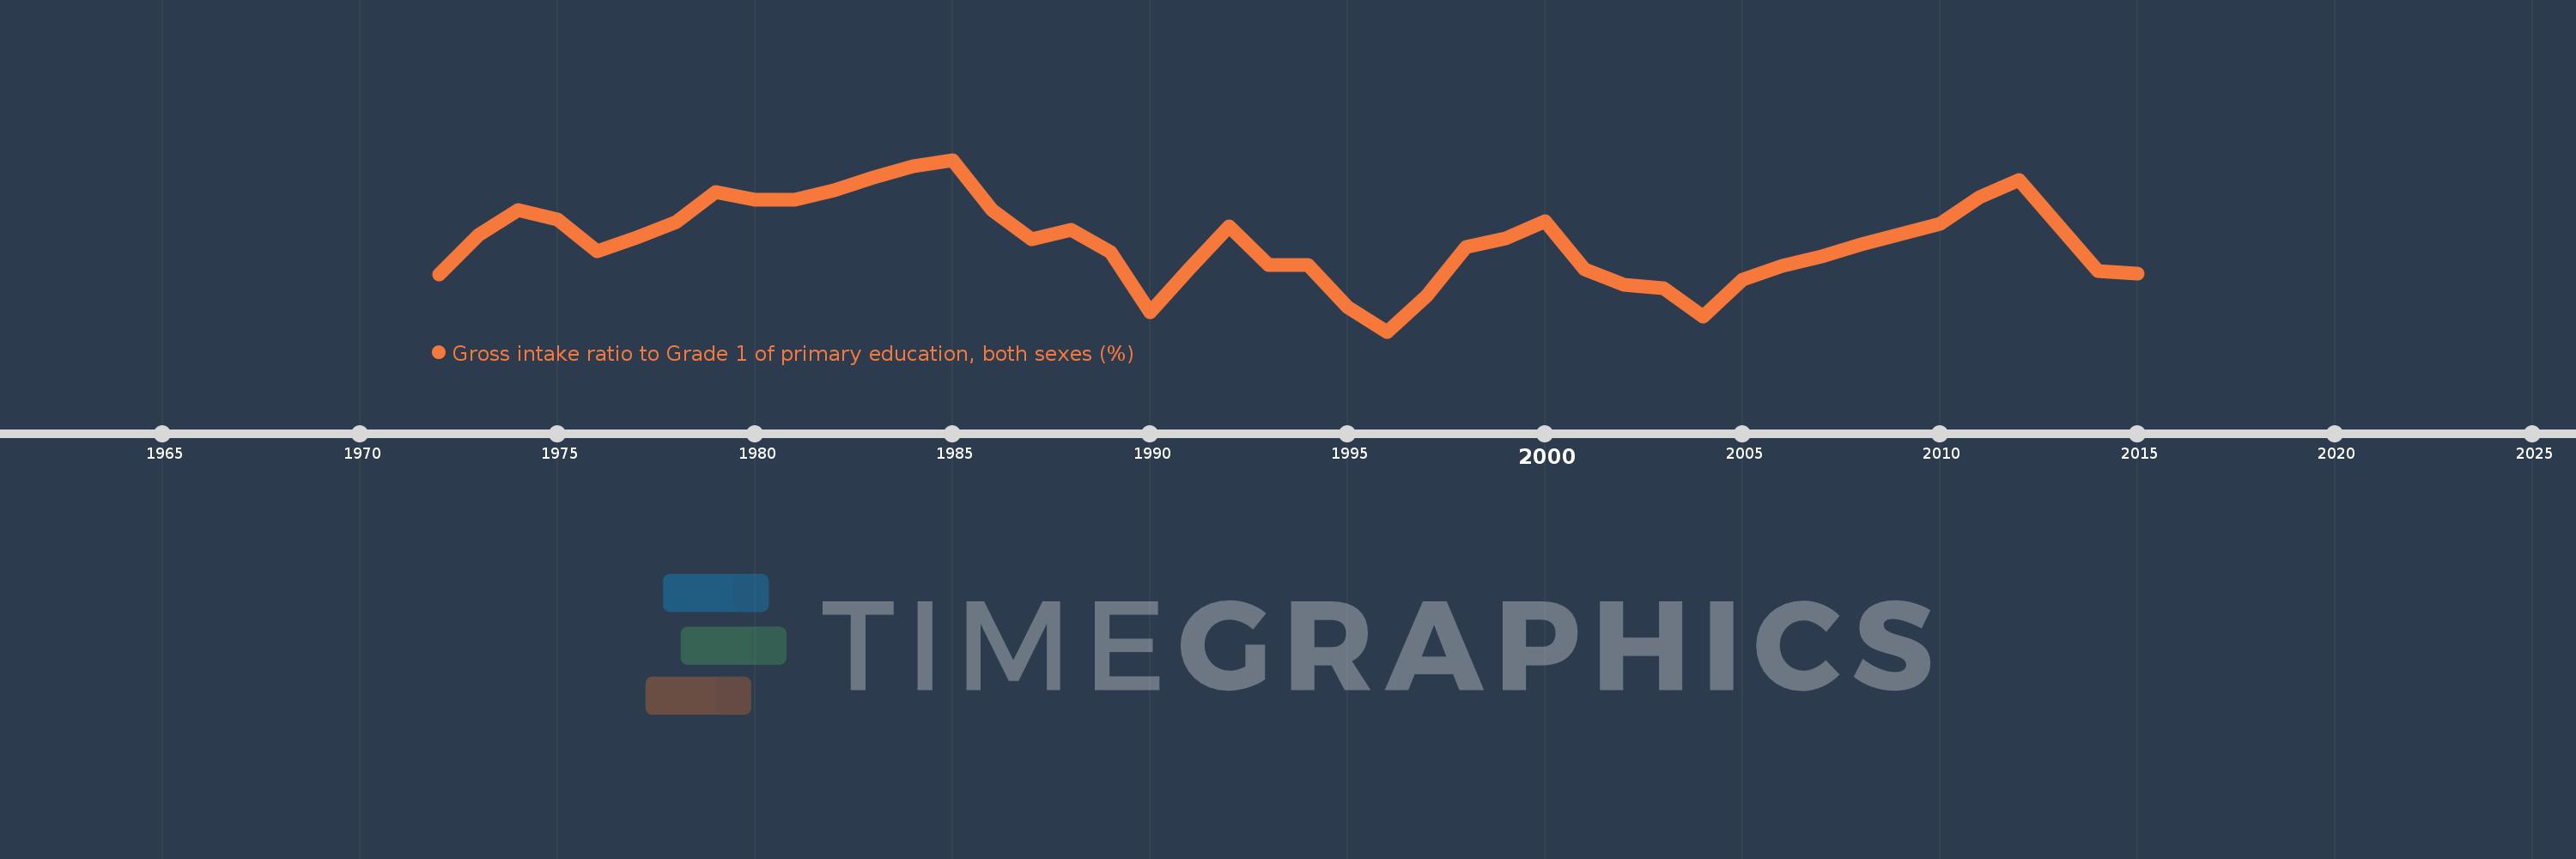
Gross intake ratio to Grade 1 of primary education, both sexes (%)
2015,2014,2012,2011,2010,2008,2007,2006,2005,2004,2003,2002,2001,2000,1999,1998,1997,1996,1995,1994,1993,1992,1991,1990,1989,1988,1987,1986,1985,1984,1983,1982,1981,1980,1979,1978,1977,1976,1975,1974,1973,1972
This statistics in other country:
AfghanistanAlbaniaAlgeriaAngolaAntigua and BarbudaArab WorldArgentinaArmeniaArubaAustriaAzerbaijanBahamas, TheBahrainBangladeshBarbadosBelarusBelgiumBelizeBeninBermudaBhutanBoliviaBosnia and HerzegovinaBotswanaBrazilBritish Virgin IslandsBrunei DarussalamBulgariaBurkina FasoBurundiCabo VerdeCambodiaCameroonCanadaCaribbean small statesCentral African RepublicCentral Europe and the BalticsChadChileChinaColombiaComorosCongo, Dem. Rep.Congo, Rep.Costa RicaCote d'IvoireCroatiaCubaCyprusCzech RepublicDenmarkDjiboutiDominicaDominican RepublicEarly-demographic dividendEast Asia & PacificEast Asia & Pacific (excluding high income)East Asia & Pacific (IDA & IBRD countries)EcuadorEgypt, Arab Rep.El SalvadorEquatorial GuineaEritreaEstoniaEthiopiaEuro areaEurope & Central AsiaEurope & Central Asia (excluding high income)Europe & Central Asia (IDA & IBRD countries)European UnionFijiFinlandFragile and conflict affected situationsFranceGabonGambia, TheGeorgiaGermanyGhanaGreeceGrenadaGuatemalaGuineaGuinea-BissauGuyanaHaitiHeavily indebted poor countries (HIPC)High incomeHondurasHong Kong SAR, ChinaHungaryIBRD onlyIcelandIDA & IBRD totalIDA blendIDA onlyIDA totalIndiaIndonesiaIran, Islamic Rep.IraqIrelandIsraelItalyJamaicaJapanJordanKazakhstanKenyaKiribatiKorea, Dem. People’s Rep.Korea, Rep.KuwaitKyrgyz RepublicLao PDRLate-demographic dividendLatin America & Caribbean Latin America & Caribbean (excluding high income)Latin America & the Caribbean (IDA & IBRD countries)LatviaLeast developed countries: UN classificationLebanonLesothoLiberiaLibyaLiechtensteinLithuaniaLow & middle incomeLow incomeLower middle incomeLuxembourgMacao SAR, ChinaMacedonia, FYRMadagascarMalawiMalaysiaMaldivesMaliMaltaMarshall IslandsMauritaniaMauritiusMexicoMicronesia, Fed. Sts.Middle East & North AfricaMiddle East & North Africa (excluding high income)Middle East & North Africa (IDA & IBRD countries)Middle incomeMoldovaMongoliaMontenegroMoroccoMozambiqueMyanmarNamibiaNauruNepalNetherlandsNew ZealandNicaraguaNigerNigeriaNorth AmericaNorwayOECD membersOmanOther small statesPacific island small statesPakistanPalauPanamaPapua New GuineaParaguayPeruPhilippinesPolandPortugalPost-demographic dividendPre-demographic dividendPuerto RicoQatarRomaniaRussian FederationRwandaSamoaSan MarinoSao Tome and PrincipeSaudi ArabiaSenegalSerbiaSeychellesSierra LeoneSlovak RepublicSloveniaSmall statesSolomon IslandsSouth AfricaSouth AsiaSouth Asia (IDA & IBRD)South SudanSpainSri LankaSt. Kitts and NevisSt. LuciaSt. Vincent and the GrenadinesSub-Saharan Africa Sub-Saharan Africa (excluding high income)Sub-Saharan Africa (IDA & IBRD countries)SudanSurinameSwazilandSwedenSwitzerlandSyrian Arab RepublicTajikistanTanzaniaThailandTimor-LesteTogoTongaTrinidad and TobagoTunisiaTurkeyTuvaluUgandaUkraineUnited Arab EmiratesUnited StatesUpper middle incomeUruguayUzbekistanVanuatuVenezuela, RBVietnamWest Bank and GazaWorldYemen, Rep.ZambiaZimbabwe Timeline:
This timeline shows a graph from 1972 to 2015 of Poland. No data until 1971. Number of actual observations by date: 42.
Source name:
World Development Indicators
Source organization:
UNESCO Institute for Statistics
Categories, topics:
Education
Last updated:
apr 23, 2017
Indicators value changes by year
Minimum:
92.867
jan 1, 1996
Maximum:
103.31
jan 1, 1985
At the date of observation
Value
Absolute change
Change from previous value
jan 1, 1972
96.318
+96.318
0.0%
jan 1, 1973
98.767
+2.45
2.54%
jan 1, 1974
100.23
+1.462
1.48%
jan 1, 1975
99.702
-0.528
-0.53%
jan 1, 1976
97.728
-1.974
-1.98%
jan 1, 1977
98.567
+0.839
0.86%
jan 1, 1978
99.55
+0.984
1.0%
jan 1, 1979
101.335
+1.785
1.79%
jan 1, 1980
100.908
-0.427
-0.42%
jan 1, 1981
100.867
-0.042
-0.04%
jan 1, 1982
101.468
+0.601
0.6%
jan 1, 1983
102.255
+0.787
0.78%
jan 1, 1984
102.907
+0.652
0.64%
jan 1, 1985
103.31
+0.403
0.39%
jan 1, 1986
100.237
-3.073
-2.97%
jan 1, 1987
98.466
-1.771
-1.77%
jan 1, 1988
99.044
+0.578
0.59%
jan 1, 1989
97.699
-1.345
-1.36%
jan 1, 1990
94.064
-3.634
-3.72%
jan 1, 1991
96.706
+2.641
2.81%
jan 1, 1992
99.274
+2.568
2.66%
jan 1, 1993
96.898
-2.376
-2.39%
jan 1, 1994
96.901
+0.003
0.0%
jan 1, 1995
94.347
-2.554
-2.64%
jan 1, 1996
92.867
-1.48
-1.57%
jan 1, 1997
95.048
+2.182
2.35%
jan 1, 1998
98.029
+2.981
3.14%
jan 1, 1999
98.509
+0.48
0.49%
jan 1, 2000
99.566
+1.058
1.07%
jan 1, 2001
96.633
-2.933
-2.95%
jan 1, 2002
95.722
-0.911
-0.94%
jan 1, 2003
95.478
-0.243
-0.25%
jan 1, 2004
93.806
-1.672
-1.75%
jan 1, 2005
96.017
+2.211
2.36%
jan 1, 2006
96.875
+0.858
0.89%
jan 1, 2007
97.423
+0.547
0.57%
jan 1, 2008
98.146
+0.723
0.74%
jan 1, 2010
99.404
+1.258
1.28%
jan 1, 2011
101.061
+1.657
1.67%
jan 1, 2012
102.08
+1.019
1.01%
jan 1, 2014
96.553
-5.527
-5.41%
jan 1, 2015
96.374
-0.179
-0.19%
Ranking of countries by current statistics by years


Comments: