29
/
en
AIzaSyAYiBZKx7MnpbEhh9jyipgxe19OcubqV5w
April 1, 2024
33479
European Union
EUU
false
2
1
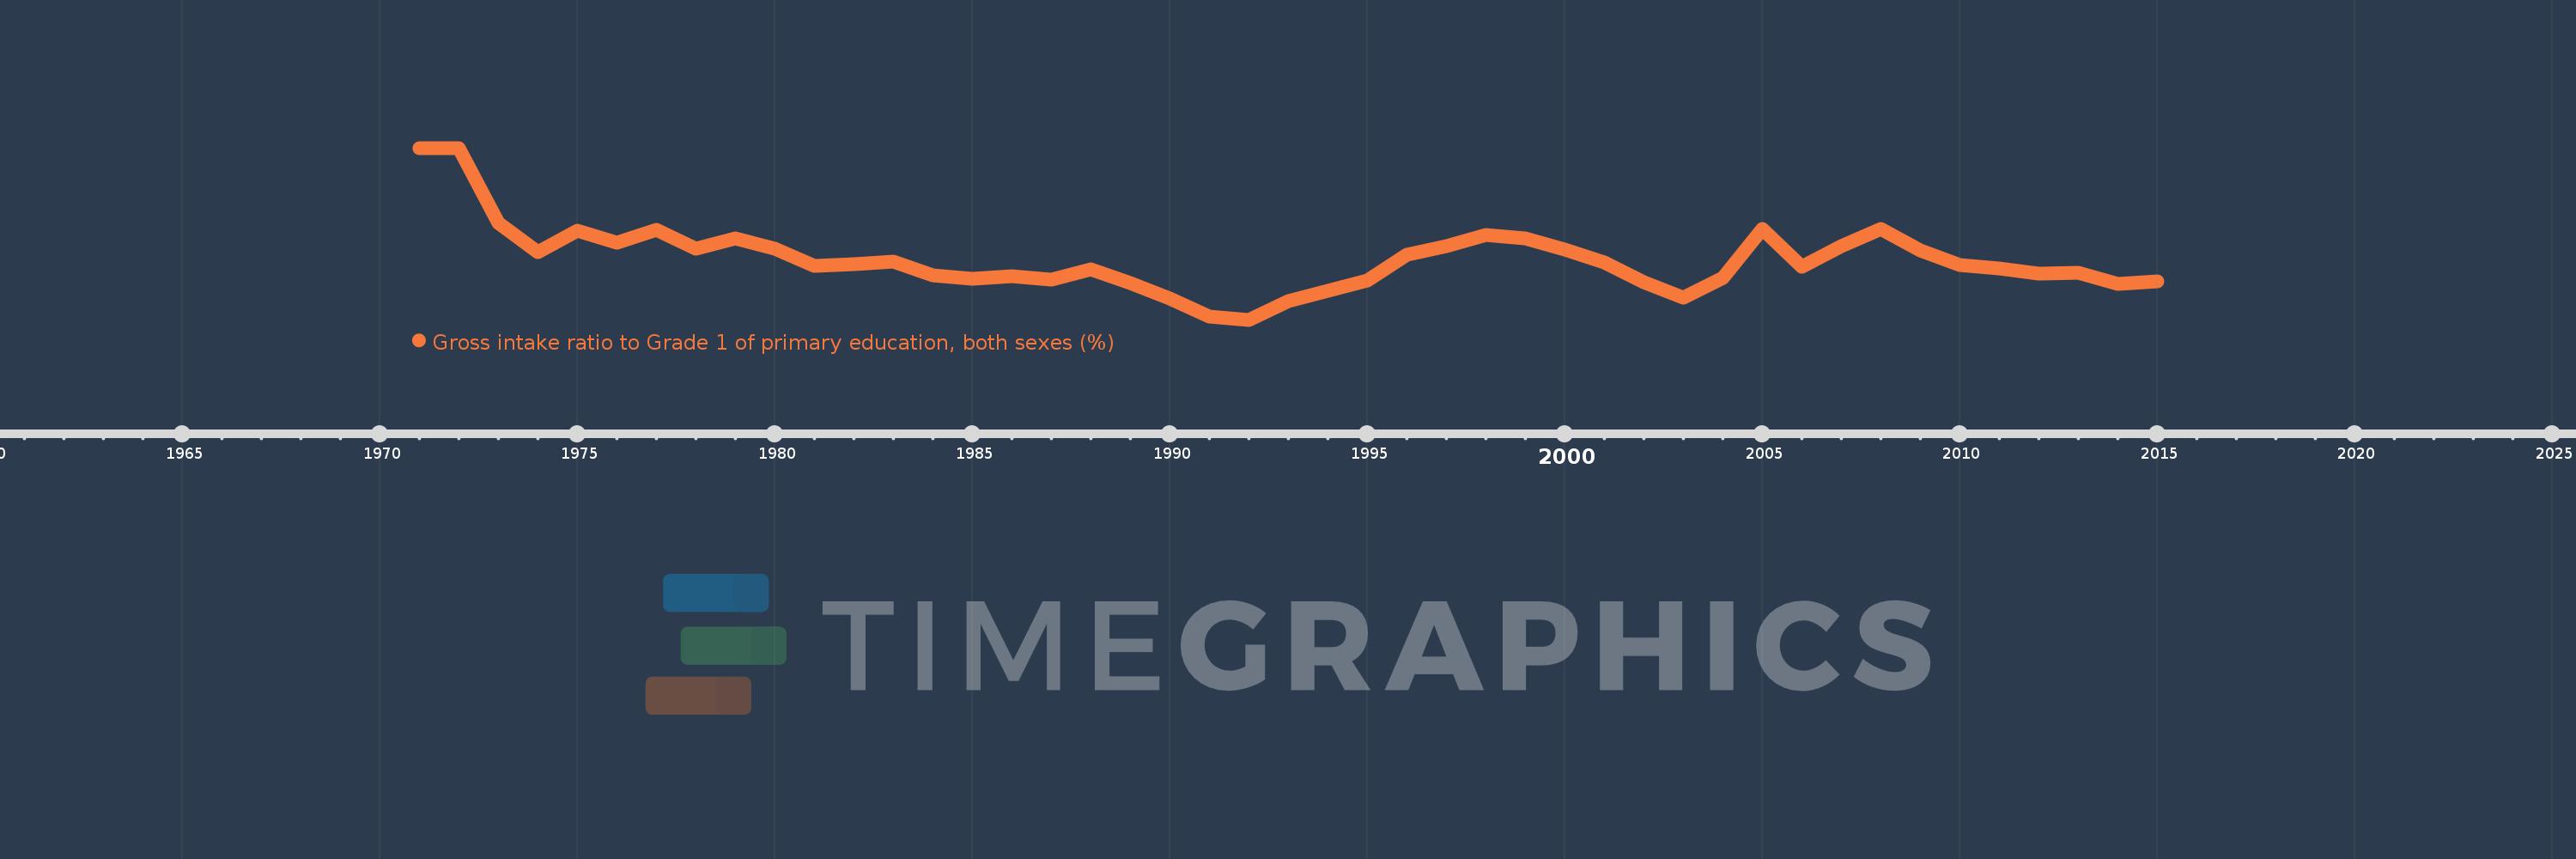
Gross intake ratio to Grade 1 of primary education, both sexes (%)
2015,2014,2013,2012,2011,2010,2009,2008,2007,2006,2005,2004,2003,2002,2001,2000,1999,1998,1997,1996,1995,1994,1993,1992,1991,1990,1989,1988,1987,1986,1985,1984,1983,1982,1981,1980,1979,1978,1977,1976,1975,1974,1973,1972,1971
This statistics in other country:
AfghanistanAlbaniaAlgeriaAngolaAntigua and BarbudaArab WorldArgentinaArmeniaArubaAustriaAzerbaijanBahamas, TheBahrainBangladeshBarbadosBelarusBelgiumBelizeBeninBermudaBhutanBoliviaBosnia and HerzegovinaBotswanaBrazilBritish Virgin IslandsBrunei DarussalamBulgariaBurkina FasoBurundiCabo VerdeCambodiaCameroonCanadaCaribbean small statesCentral African RepublicCentral Europe and the BalticsChadChileChinaColombiaComorosCongo, Dem. Rep.Congo, Rep.Costa RicaCote d'IvoireCroatiaCubaCyprusCzech RepublicDenmarkDjiboutiDominicaDominican RepublicEarly-demographic dividendEast Asia & PacificEast Asia & Pacific (excluding high income)East Asia & Pacific (IDA & IBRD countries)EcuadorEgypt, Arab Rep.El SalvadorEquatorial GuineaEritreaEstoniaEthiopiaEuro areaEurope & Central AsiaEurope & Central Asia (excluding high income)Europe & Central Asia (IDA & IBRD countries)European UnionFijiFinlandFragile and conflict affected situationsFranceGabonGambia, TheGeorgiaGermanyGhanaGreeceGrenadaGuatemalaGuineaGuinea-BissauGuyanaHaitiHeavily indebted poor countries (HIPC)High incomeHondurasHong Kong SAR, ChinaHungaryIBRD onlyIcelandIDA & IBRD totalIDA blendIDA onlyIDA totalIndiaIndonesiaIran, Islamic Rep.IraqIrelandIsraelItalyJamaicaJapanJordanKazakhstanKenyaKiribatiKorea, Dem. People’s Rep.Korea, Rep.KuwaitKyrgyz RepublicLao PDRLate-demographic dividendLatin America & Caribbean Latin America & Caribbean (excluding high income)Latin America & the Caribbean (IDA & IBRD countries)LatviaLeast developed countries: UN classificationLebanonLesothoLiberiaLibyaLiechtensteinLithuaniaLow & middle incomeLow incomeLower middle incomeLuxembourgMacao SAR, ChinaMacedonia, FYRMadagascarMalawiMalaysiaMaldivesMaliMaltaMarshall IslandsMauritaniaMauritiusMexicoMicronesia, Fed. Sts.Middle East & North AfricaMiddle East & North Africa (excluding high income)Middle East & North Africa (IDA & IBRD countries)Middle incomeMoldovaMongoliaMontenegroMoroccoMozambiqueMyanmarNamibiaNauruNepalNetherlandsNew ZealandNicaraguaNigerNigeriaNorth AmericaNorwayOECD membersOmanOther small statesPacific island small statesPakistanPalauPanamaPapua New GuineaParaguayPeruPhilippinesPolandPortugalPost-demographic dividendPre-demographic dividendPuerto RicoQatarRomaniaRussian FederationRwandaSamoaSan MarinoSao Tome and PrincipeSaudi ArabiaSenegalSerbiaSeychellesSierra LeoneSlovak RepublicSloveniaSmall statesSolomon IslandsSouth AfricaSouth AsiaSouth Asia (IDA & IBRD)South SudanSpainSri LankaSt. Kitts and NevisSt. LuciaSt. Vincent and the GrenadinesSub-Saharan Africa Sub-Saharan Africa (excluding high income)Sub-Saharan Africa (IDA & IBRD countries)SudanSurinameSwazilandSwedenSwitzerlandSyrian Arab RepublicTajikistanTanzaniaThailandTimor-LesteTogoTongaTrinidad and TobagoTunisiaTurkeyTuvaluUgandaUkraineUnited Arab EmiratesUnited StatesUpper middle incomeUruguayUzbekistanVanuatuVenezuela, RBVietnamWest Bank and GazaWorldYemen, Rep.ZambiaZimbabwe Timeline:
This timeline shows a graph from 1971 to 2015 of European Union. No data until 1970. Number of actual observations by date: 45.
Source name:
World Development Indicators
Source organization:
UNESCO Institute for Statistics
Categories, topics:
Education
Last updated:
apr 23, 2017
Indicators value changes by year
Minimum:
97.384
jan 1, 1992
Maximum:
106.179
jan 1, 1972
At the date of observation
Value
Absolute change
Change from previous value
jan 1, 1971
106.15
+106.15
0.0%
jan 1, 1972
106.179
+0.03
0.03%
jan 1, 1973
102.334
-3.845
-3.62%
jan 1, 1974
100.841
-1.493
-1.46%
jan 1, 1975
101.948
+1.107
1.1%
jan 1, 1976
101.309
-0.639
-0.63%
jan 1, 1977
102.01
+0.7
0.69%
jan 1, 1978
101.011
-0.998
-0.98%
jan 1, 1979
101.552
+0.541
0.54%
jan 1, 1980
101.036
-0.516
-0.51%
jan 1, 1981
100.124
-0.913
-0.9%
jan 1, 1982
100.24
+0.116
0.12%
jan 1, 1983
100.369
+0.13
0.13%
jan 1, 1984
99.639
-0.731
-0.73%
jan 1, 1985
99.486
-0.152
-0.15%
jan 1, 1986
99.606
+0.12
0.12%
jan 1, 1987
99.439
-0.168
-0.17%
jan 1, 1988
99.987
+0.548
0.55%
jan 1, 1989
99.257
-0.73
-0.73%
jan 1, 1990
98.487
-0.77
-0.78%
jan 1, 1991
97.548
-0.939
-0.95%
jan 1, 1992
97.384
-0.164
-0.17%
jan 1, 1993
98.319
+0.935
0.96%
jan 1, 1994
98.876
+0.558
0.57%
jan 1, 1995
99.412
+0.536
0.54%
jan 1, 1996
100.728
+1.316
1.32%
jan 1, 1997
101.165
+0.437
0.43%
jan 1, 1998
101.733
+0.568
0.56%
jan 1, 1999
101.54
-0.193
-0.19%
jan 1, 2000
100.986
-0.555
-0.55%
jan 1, 2001
100.313
-0.673
-0.67%
jan 1, 2002
99.322
-0.991
-0.99%
jan 1, 2003
98.536
-0.786
-0.79%
jan 1, 2004
99.532
+0.996
1.01%
jan 1, 2005
102.05
+2.518
2.53%
jan 1, 2006
100.102
-1.948
-1.91%
jan 1, 2007
101.154
+1.052
1.05%
jan 1, 2008
102.018
+0.865
0.86%
jan 1, 2009
100.925
-1.093
-1.07%
jan 1, 2010
100.187
-0.738
-0.73%
jan 1, 2011
100.023
-0.164
-0.16%
jan 1, 2012
99.754
-0.269
-0.27%
jan 1, 2013
99.802
+0.049
0.05%
jan 1, 2014
99.212
-0.59
-0.59%
jan 1, 2015
99.341
+0.129
0.13%
Ranking of countries by current statistics by years


Comments: