29
/
en
AIzaSyAYiBZKx7MnpbEhh9jyipgxe19OcubqV5w
April 1, 2024
195617
Mexico
MEX
true
2
1
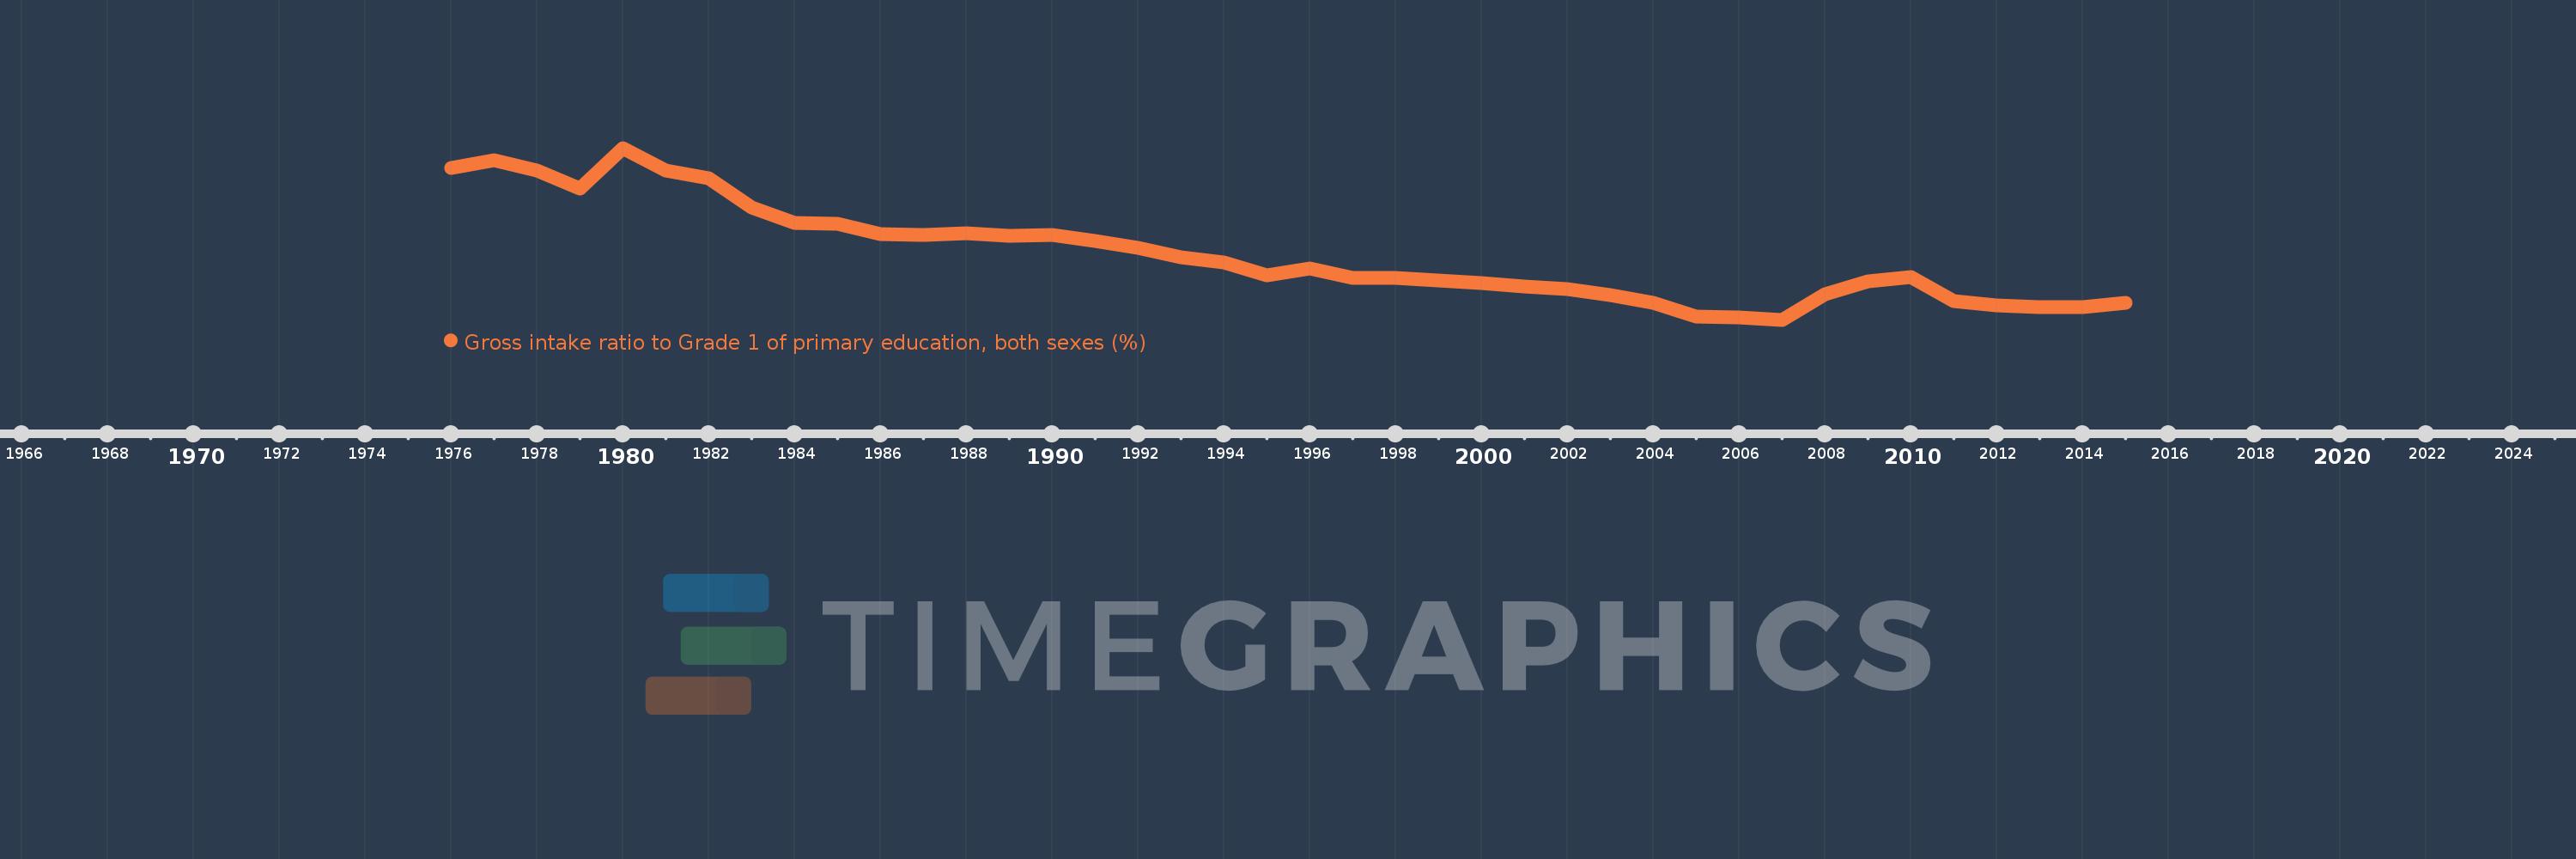
Gross intake ratio to Grade 1 of primary education, both sexes (%)
2015,2014,2013,2012,2011,2010,2009,2008,2007,2006,2005,2004,2003,2002,2001,2000,1998,1997,1996,1995,1994,1993,1992,1991,1990,1989,1988,1987,1986,1985,1984,1983,1982,1981,1980,1979,1978,1977,1976
This statistics in other country:
AfghanistanAlbaniaAlgeriaAngolaAntigua and BarbudaArab WorldArgentinaArmeniaArubaAustriaAzerbaijanBahamas, TheBahrainBangladeshBarbadosBelarusBelgiumBelizeBeninBermudaBhutanBoliviaBosnia and HerzegovinaBotswanaBrazilBritish Virgin IslandsBrunei DarussalamBulgariaBurkina FasoBurundiCabo VerdeCambodiaCameroonCanadaCaribbean small statesCentral African RepublicCentral Europe and the BalticsChadChileChinaColombiaComorosCongo, Dem. Rep.Congo, Rep.Costa RicaCote d'IvoireCroatiaCubaCyprusCzech RepublicDenmarkDjiboutiDominicaDominican RepublicEarly-demographic dividendEast Asia & PacificEast Asia & Pacific (excluding high income)East Asia & Pacific (IDA & IBRD countries)EcuadorEgypt, Arab Rep.El SalvadorEquatorial GuineaEritreaEstoniaEthiopiaEuro areaEurope & Central AsiaEurope & Central Asia (excluding high income)Europe & Central Asia (IDA & IBRD countries)European UnionFijiFinlandFragile and conflict affected situationsFranceGabonGambia, TheGeorgiaGermanyGhanaGreeceGrenadaGuatemalaGuineaGuinea-BissauGuyanaHaitiHeavily indebted poor countries (HIPC)High incomeHondurasHong Kong SAR, ChinaHungaryIBRD onlyIcelandIDA & IBRD totalIDA blendIDA onlyIDA totalIndiaIndonesiaIran, Islamic Rep.IraqIrelandIsraelItalyJamaicaJapanJordanKazakhstanKenyaKiribatiKorea, Dem. People’s Rep.Korea, Rep.KuwaitKyrgyz RepublicLao PDRLate-demographic dividendLatin America & Caribbean Latin America & Caribbean (excluding high income)Latin America & the Caribbean (IDA & IBRD countries)LatviaLeast developed countries: UN classificationLebanonLesothoLiberiaLibyaLiechtensteinLithuaniaLow & middle incomeLow incomeLower middle incomeLuxembourgMacao SAR, ChinaMacedonia, FYRMadagascarMalawiMalaysiaMaldivesMaliMaltaMarshall IslandsMauritaniaMauritiusMexicoMicronesia, Fed. Sts.Middle East & North AfricaMiddle East & North Africa (excluding high income)Middle East & North Africa (IDA & IBRD countries)Middle incomeMoldovaMongoliaMontenegroMoroccoMozambiqueMyanmarNamibiaNauruNepalNetherlandsNew ZealandNicaraguaNigerNigeriaNorth AmericaNorwayOECD membersOmanOther small statesPacific island small statesPakistanPalauPanamaPapua New GuineaParaguayPeruPhilippinesPolandPortugalPost-demographic dividendPre-demographic dividendPuerto RicoQatarRomaniaRussian FederationRwandaSamoaSan MarinoSao Tome and PrincipeSaudi ArabiaSenegalSerbiaSeychellesSierra LeoneSlovak RepublicSloveniaSmall statesSolomon IslandsSouth AfricaSouth AsiaSouth Asia (IDA & IBRD)South SudanSpainSri LankaSt. Kitts and NevisSt. LuciaSt. Vincent and the GrenadinesSub-Saharan Africa Sub-Saharan Africa (excluding high income)Sub-Saharan Africa (IDA & IBRD countries)SudanSurinameSwazilandSwedenSwitzerlandSyrian Arab RepublicTajikistanTanzaniaThailandTimor-LesteTogoTongaTrinidad and TobagoTunisiaTurkeyTuvaluUgandaUkraineUnited Arab EmiratesUnited StatesUpper middle incomeUruguayUzbekistanVanuatuVenezuela, RBVietnamWest Bank and GazaWorldYemen, Rep.ZambiaZimbabwe Timeline:
This timeline shows a graph from 1976 to 2015 of Mexico. No data until 1975. Number of actual observations by date: 39.
Source name:
World Development Indicators
Source organization:
UNESCO Institute for Statistics
Categories, topics:
Education
Last updated:
apr 23, 2017
Indicators value changes by year
Minimum:
97.137
jan 1, 2007
Maximum:
139.188
jan 1, 1980
At the date of observation
Value
Absolute change
Change from previous value
jan 1, 1976
134.345
+134.345
0.0%
jan 1, 1977
136.186
+1.841
1.37%
jan 1, 1978
133.661
-2.525
-1.85%
jan 1, 1979
129.252
-4.409
-3.3%
jan 1, 1980
139.188
+9.936
7.69%
jan 1, 1981
133.682
-5.506
-3.96%
jan 1, 1982
131.725
-1.957
-1.46%
jan 1, 1983
124.656
-7.069
-5.37%
jan 1, 1984
120.851
-3.806
-3.05%
jan 1, 1985
120.587
-0.264
-0.22%
jan 1, 1986
118.192
-2.394
-1.99%
jan 1, 1987
117.936
-0.256
-0.22%
jan 1, 1988
118.354
+0.419
0.36%
jan 1, 1989
117.73
-0.625
-0.53%
jan 1, 1990
117.829
+0.099
0.08%
jan 1, 1991
116.474
-1.354
-1.15%
jan 1, 1992
114.787
-1.688
-1.45%
jan 1, 1993
112.327
-2.46
-2.14%
jan 1, 1994
111.096
-1.231
-1.1%
jan 1, 1995
108.048
-3.048
-2.74%
jan 1, 1996
109.754
+1.706
1.58%
jan 1, 1997
107.288
-2.465
-2.25%
jan 1, 1998
107.348
+0.059
0.06%
jan 1, 2000
106.195
-1.153
-1.07%
jan 1, 2001
105.282
-0.913
-0.86%
jan 1, 2002
104.668
-0.614
-0.58%
jan 1, 2003
103.134
-1.534
-1.47%
jan 1, 2004
101.305
-1.829
-1.77%
jan 1, 2005
97.825
-3.48
-3.44%
jan 1, 2006
97.736
-0.089
-0.09%
jan 1, 2007
97.137
-0.6
-0.61%
jan 1, 2008
103.354
+6.217
6.4%
jan 1, 2009
106.546
+3.192
3.09%
jan 1, 2010
107.521
+0.975
0.92%
jan 1, 2011
101.604
-5.917
-5.5%
jan 1, 2012
100.747
-0.857
-0.84%
jan 1, 2013
100.313
-0.434
-0.43%
jan 1, 2014
100.286
-0.027
-0.03%
jan 1, 2015
101.303
+1.017
1.01%
Ranking of countries by current statistics by years


Comments: