29
/
en
AIzaSyAYiBZKx7MnpbEhh9jyipgxe19OcubqV5w
April 1, 2024
77972
Bangladesh
BGD
true
2
1
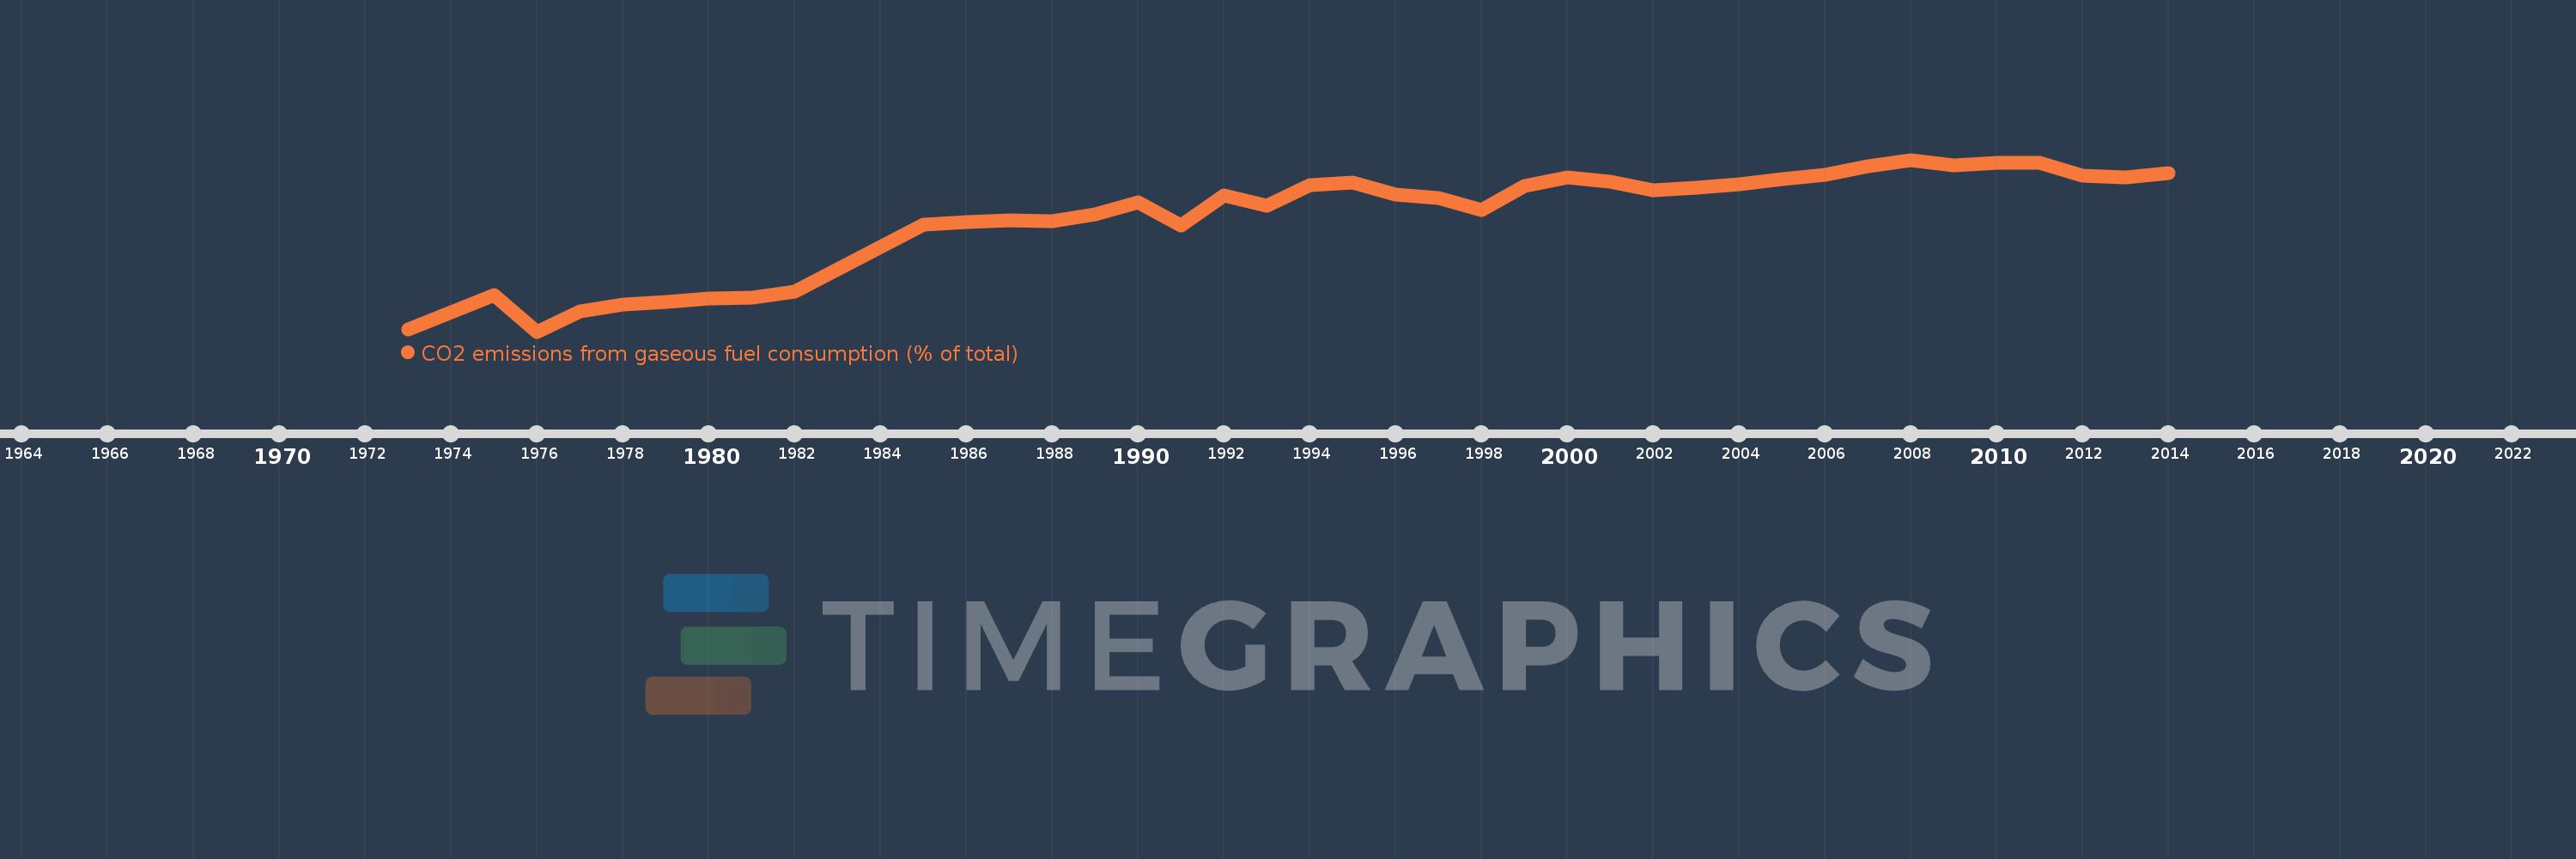
CO2 emissions from gaseous fuel consumption (% of total)
2014,2013,2012,2011,2010,2009,2008,2007,2006,2005,2004,2003,2002,2001,2000,1999,1998,1997,1996,1995,1994,1993,1992,1991,1990,1989,1988,1987,1986,1985,1984,1983,1982,1981,1980,1979,1978,1977,1976,1975,1974,1973
This statistics in other country:
AfghanistanAlbaniaAlgeriaAndorraAngolaAntigua and BarbudaArab WorldArgentinaArmeniaArubaAustraliaAustriaAzerbaijanBahamas, TheBahrainBangladeshBarbadosBelarusBelgiumBelizeBeninBermudaBhutanBoliviaBosnia and HerzegovinaBotswanaBrazilBritish Virgin IslandsBrunei DarussalamBulgariaBurkina FasoBurundiCabo VerdeCambodiaCameroonCanadaCaribbean small statesCayman IslandsCentral African RepublicCentral Europe and the BalticsChadChileChinaColombiaComorosCongo, Dem. Rep.Congo, Rep.Costa RicaCote d'IvoireCroatiaCubaCuracaoCyprusCzech RepublicDenmarkDjiboutiDominicaDominican RepublicEarly-demographic dividendEast Asia & PacificEast Asia & Pacific (excluding high income)East Asia & Pacific (IDA & IBRD countries)EcuadorEgypt, Arab Rep.El SalvadorEquatorial GuineaEritreaEstoniaEthiopiaEuro areaEurope & Central AsiaEurope & Central Asia (excluding high income)Europe & Central Asia (IDA & IBRD countries)European UnionFaroe IslandsFijiFinlandFragile and conflict affected situationsFranceFrench PolynesiaGabonGambia, TheGeorgiaGermanyGhanaGibraltarGreeceGreenlandGrenadaGuatemalaGuineaGuinea-BissauGuyanaHaitiHeavily indebted poor countries (HIPC)High incomeHondurasHong Kong SAR, ChinaHungaryIBRD onlyIcelandIDA & IBRD totalIDA blendIDA onlyIDA totalIndiaIndonesiaIran, Islamic Rep.IraqIrelandIsraelItalyJamaicaJapanJordanKazakhstanKenyaKiribatiKorea, Dem. People’s Rep.Korea, Rep.KuwaitKyrgyz RepublicLao PDRLate-demographic dividendLatin America & Caribbean Latin America & Caribbean (excluding high income)Latin America & the Caribbean (IDA & IBRD countries)LatviaLeast developed countries: UN classificationLebanonLesothoLiberiaLibyaLiechtensteinLithuaniaLow & middle incomeLow incomeLower middle incomeLuxembourgMacao SAR, ChinaMacedonia, FYRMadagascarMalawiMalaysiaMaldivesMaliMaltaMarshall IslandsMauritaniaMauritiusMexicoMicronesia, Fed. Sts.Middle East & North AfricaMiddle East & North Africa (excluding high income)Middle East & North Africa (IDA & IBRD countries)Middle incomeMoldovaMongoliaMontenegroMoroccoMozambiqueMyanmarNamibiaNauruNepalNetherlandsNew CaledoniaNew ZealandNicaraguaNigerNigeriaNorth AmericaNorwayOECD membersOmanOther small statesPacific island small statesPakistanPalauPanamaPapua New GuineaParaguayPeruPhilippinesPolandPortugalPost-demographic dividendPre-demographic dividendQatarRomaniaRussian FederationRwandaSamoaSao Tome and PrincipeSaudi ArabiaSenegalSerbiaSeychellesSierra LeoneSingaporeSint Maarten (Dutch part)Slovak RepublicSloveniaSmall statesSolomon IslandsSomaliaSouth AfricaSouth AsiaSouth Asia (IDA & IBRD)South SudanSpainSri LankaSt. Kitts and NevisSt. LuciaSt. Vincent and the GrenadinesSub-Saharan Africa Sub-Saharan Africa (excluding high income)Sub-Saharan Africa (IDA & IBRD countries)SudanSurinameSwazilandSwedenSwitzerlandSyrian Arab RepublicTajikistanTanzaniaThailandTimor-LesteTogoTongaTrinidad and TobagoTunisiaTurkeyTurkmenistanTurks and Caicos IslandsUgandaUkraineUnited Arab EmiratesUnited KingdomUnited StatesUpper middle incomeUruguayUzbekistanVanuatuVenezuela, RBVietnamWest Bank and GazaWorldYemen, Rep.ZambiaZimbabwe Timeline:
This timeline shows a graph from 1973 to 2014 of Bangladesh. No data until 1972. Number of actual observations by date: 42.
Source name:
World Development Indicators
Source organization:
Carbon Dioxide Information Analysis Center, Environmental Sciences Division, Oak Ridge National Laboratory, Tennessee, United States.
Categories, topics:
Energy & Mining, Climate Change, Environment
Last updated:
apr 23, 2017
Indicators value changes by year
Minimum:
19.804
jan 1, 1976
Maximum:
66.664
jan 1, 2008
At the date of observation
Value
Absolute change
Change from previous value
jan 1, 1973
20.376
+20.376
0.0%
jan 1, 1974
25.121
+4.745
23.29%
jan 1, 1975
29.662
+4.541
18.08%
jan 1, 1976
19.804
-9.857
-33.23%
jan 1, 1977
25.346
+5.541
27.98%
jan 1, 1978
27.192
+1.847
7.29%
jan 1, 1979
27.849
+0.656
2.41%
jan 1, 1980
28.847
+0.998
3.58%
jan 1, 1981
29.045
+0.197
0.68%
jan 1, 1982
30.791
+1.746
6.01%
jan 1, 1983
36.844
+6.054
19.66%
jan 1, 1984
42.787
+5.943
16.13%
jan 1, 1985
48.995
+6.208
14.51%
jan 1, 1986
49.731
+0.736
1.5%
jan 1, 1987
50.064
+0.333
0.67%
jan 1, 1988
50.015
-0.049
-0.1%
jan 1, 1989
51.705
+1.69
3.38%
jan 1, 1990
55.165
+3.459
6.69%
jan 1, 1991
48.82
-6.345
-11.5%
jan 1, 1992
56.867
+8.047
16.48%
jan 1, 1993
54.174
-2.693
-4.74%
jan 1, 1994
59.743
+5.569
10.28%
jan 1, 1995
60.526
+0.783
1.31%
jan 1, 1996
57.152
-3.374
-5.57%
jan 1, 1997
56.219
-0.934
-1.63%
jan 1, 1998
52.963
-3.256
-5.79%
jan 1, 1999
59.607
+6.644
12.54%
jan 1, 2000
61.93
+2.323
3.9%
jan 1, 2001
60.618
-1.311
-2.12%
jan 1, 2002
58.287
-2.331
-3.85%
jan 1, 2003
59.051
+0.764
1.31%
jan 1, 2004
60.012
+0.961
1.63%
jan 1, 2005
61.292
+1.279
2.13%
jan 1, 2006
62.679
+1.387
2.26%
jan 1, 2007
64.949
+2.27
3.62%
jan 1, 2008
66.664
+1.715
2.64%
jan 1, 2009
65.076
-1.588
-2.38%
jan 1, 2010
65.901
+0.826
1.27%
jan 1, 2011
65.727
-0.174
-0.26%
jan 1, 2012
62.385
-3.343
-5.09%
jan 1, 2013
61.868
-0.516
-0.83%
jan 1, 2014
62.963
+1.095
1.77%
Ranking of countries by current statistics by years


Comments: