29
/
en
AIzaSyAYiBZKx7MnpbEhh9jyipgxe19OcubqV5w
April 1, 2024
72779
Australia
AUS
true
2
1
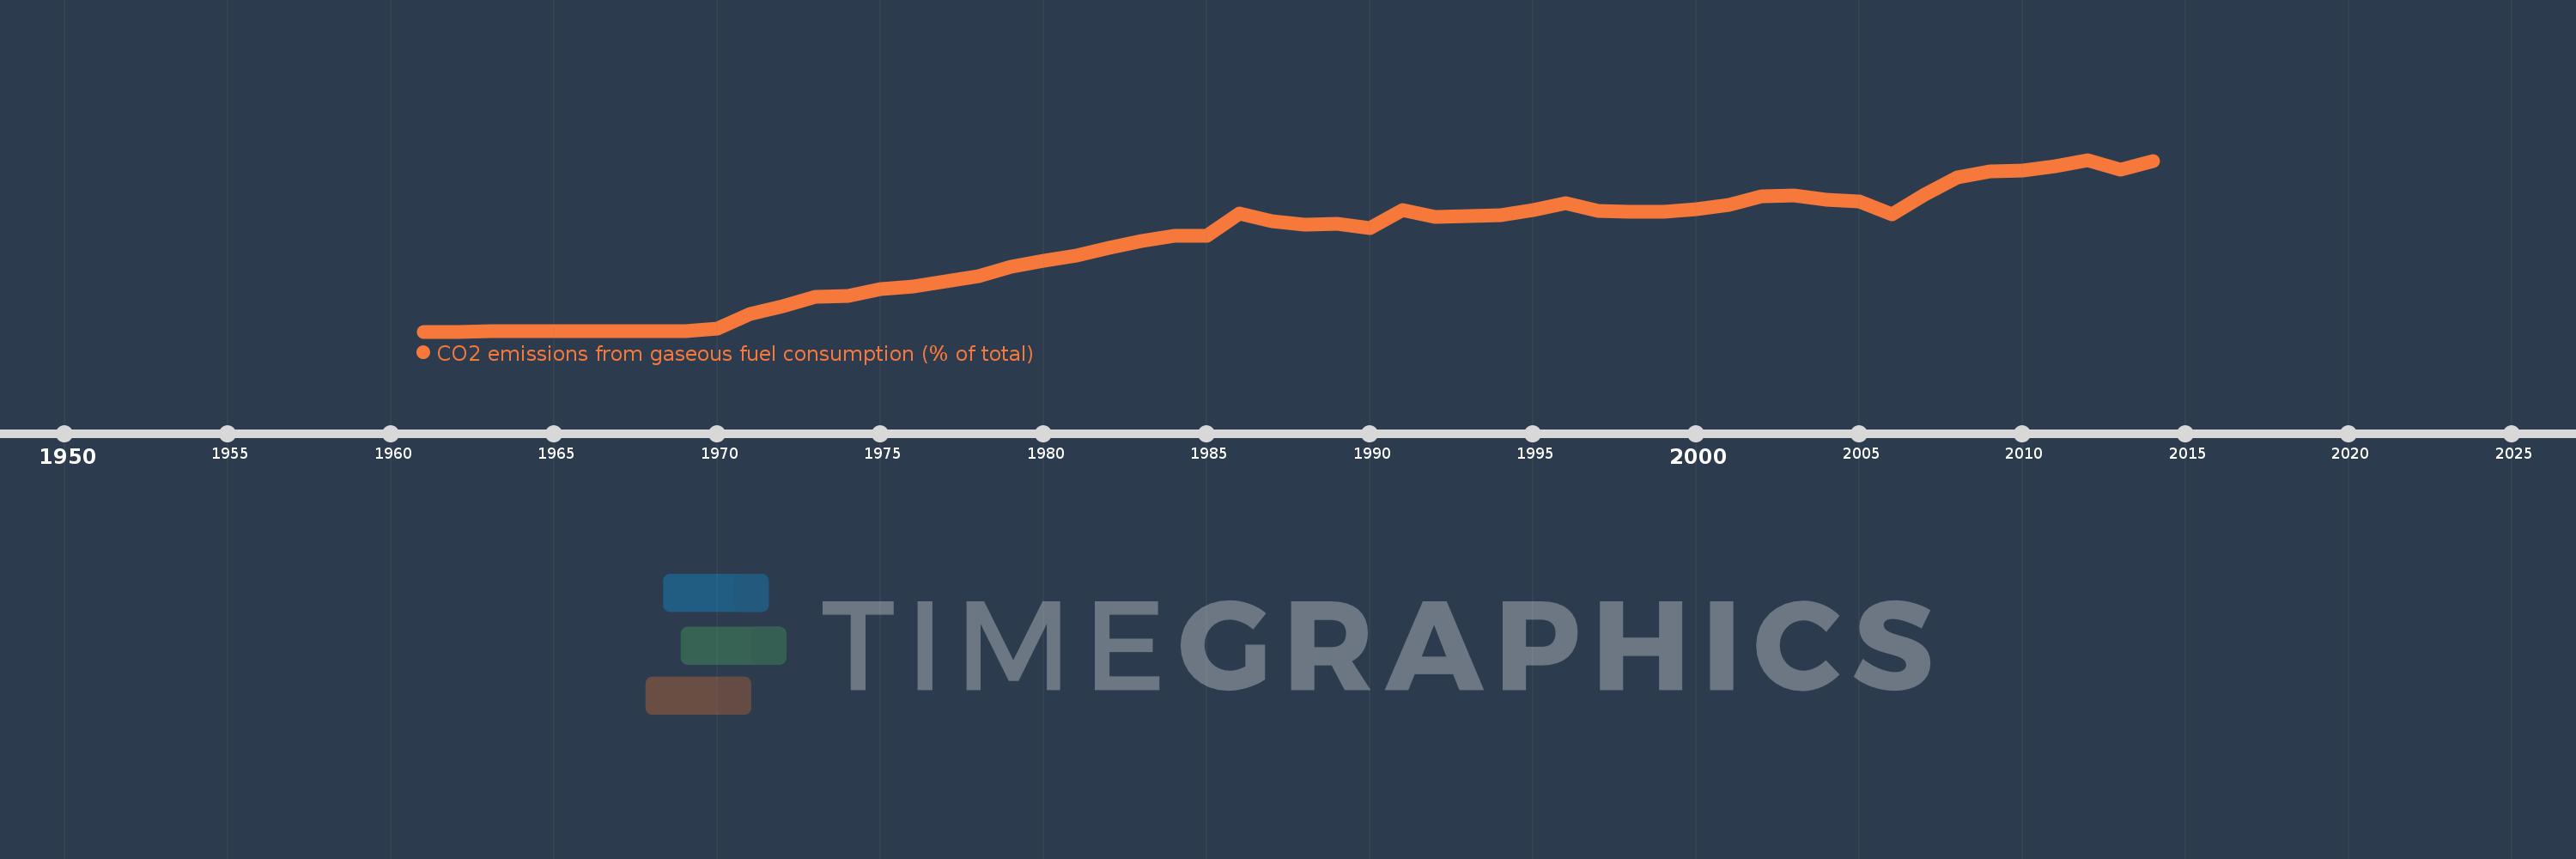
CO2 emissions from gaseous fuel consumption (% of total)
2014,2013,2012,2011,2010,2009,2008,2007,2006,2005,2004,2003,2002,2001,2000,1999,1998,1997,1996,1995,1994,1993,1992,1991,1990,1989,1988,1987,1986,1985,1984,1983,1982,1981,1980,1979,1978,1977,1976,1975,1974,1973,1972,1971,1970,1969,1968,1967,1966,1965,1964,1963,1962,1961
This statistics in other country:
AfghanistanAlbaniaAlgeriaAndorraAngolaAntigua and BarbudaArab WorldArgentinaArmeniaArubaAustraliaAustriaAzerbaijanBahamas, TheBahrainBangladeshBarbadosBelarusBelgiumBelizeBeninBermudaBhutanBoliviaBosnia and HerzegovinaBotswanaBrazilBritish Virgin IslandsBrunei DarussalamBulgariaBurkina FasoBurundiCabo VerdeCambodiaCameroonCanadaCaribbean small statesCayman IslandsCentral African RepublicCentral Europe and the BalticsChadChileChinaColombiaComorosCongo, Dem. Rep.Congo, Rep.Costa RicaCote d'IvoireCroatiaCubaCuracaoCyprusCzech RepublicDenmarkDjiboutiDominicaDominican RepublicEarly-demographic dividendEast Asia & PacificEast Asia & Pacific (excluding high income)East Asia & Pacific (IDA & IBRD countries)EcuadorEgypt, Arab Rep.El SalvadorEquatorial GuineaEritreaEstoniaEthiopiaEuro areaEurope & Central AsiaEurope & Central Asia (excluding high income)Europe & Central Asia (IDA & IBRD countries)European UnionFaroe IslandsFijiFinlandFragile and conflict affected situationsFranceFrench PolynesiaGabonGambia, TheGeorgiaGermanyGhanaGibraltarGreeceGreenlandGrenadaGuatemalaGuineaGuinea-BissauGuyanaHaitiHeavily indebted poor countries (HIPC)High incomeHondurasHong Kong SAR, ChinaHungaryIBRD onlyIcelandIDA & IBRD totalIDA blendIDA onlyIDA totalIndiaIndonesiaIran, Islamic Rep.IraqIrelandIsraelItalyJamaicaJapanJordanKazakhstanKenyaKiribatiKorea, Dem. People’s Rep.Korea, Rep.KuwaitKyrgyz RepublicLao PDRLate-demographic dividendLatin America & Caribbean Latin America & Caribbean (excluding high income)Latin America & the Caribbean (IDA & IBRD countries)LatviaLeast developed countries: UN classificationLebanonLesothoLiberiaLibyaLiechtensteinLithuaniaLow & middle incomeLow incomeLower middle incomeLuxembourgMacao SAR, ChinaMacedonia, FYRMadagascarMalawiMalaysiaMaldivesMaliMaltaMarshall IslandsMauritaniaMauritiusMexicoMicronesia, Fed. Sts.Middle East & North AfricaMiddle East & North Africa (excluding high income)Middle East & North Africa (IDA & IBRD countries)Middle incomeMoldovaMongoliaMontenegroMoroccoMozambiqueMyanmarNamibiaNauruNepalNetherlandsNew CaledoniaNew ZealandNicaraguaNigerNigeriaNorth AmericaNorwayOECD membersOmanOther small statesPacific island small statesPakistanPalauPanamaPapua New GuineaParaguayPeruPhilippinesPolandPortugalPost-demographic dividendPre-demographic dividendQatarRomaniaRussian FederationRwandaSamoaSao Tome and PrincipeSaudi ArabiaSenegalSerbiaSeychellesSierra LeoneSingaporeSint Maarten (Dutch part)Slovak RepublicSloveniaSmall statesSolomon IslandsSomaliaSouth AfricaSouth AsiaSouth Asia (IDA & IBRD)South SudanSpainSri LankaSt. Kitts and NevisSt. LuciaSt. Vincent and the GrenadinesSub-Saharan Africa Sub-Saharan Africa (excluding high income)Sub-Saharan Africa (IDA & IBRD countries)SudanSurinameSwazilandSwedenSwitzerlandSyrian Arab RepublicTajikistanTanzaniaThailandTimor-LesteTogoTongaTrinidad and TobagoTunisiaTurkeyTurkmenistanTurks and Caicos IslandsUgandaUkraineUnited Arab EmiratesUnited KingdomUnited StatesUpper middle incomeUruguayUzbekistanVanuatuVenezuela, RBVietnamWest Bank and GazaWorldYemen, Rep.ZambiaZimbabwe Timeline:
This timeline shows a graph from 1961 to 2014 of Australia. No data until 1960. Number of actual observations by date: 54.
Source name:
World Development Indicators
Source organization:
Carbon Dioxide Information Analysis Center, Environmental Sciences Division, Oak Ridge National Laboratory, Tennessee, United States.
Categories, topics:
Energy & Mining, Climate Change, Environment
Last updated:
apr 23, 2017
Indicators value changes by year
At the date of observation
Value
Absolute change
Change from previous value
jan 1, 1963
0.004
+0.004
%
jan 1, 1964
0.007
+0.003
87.89%
jan 1, 1965
0.007
-0.001
-7.29%
jan 1, 1966
0.006
-0.001
-9.91%
jan 1, 1967
0.006
+0.0
0.53%
jan 1, 1968
0.006
0.0
-6.91%
jan 1, 1969
0.008
+0.002
44.03%
jan 1, 1970
0.343
+0.335
4.1K%
jan 1, 1971
1.868
+1.525
444.88%
jan 1, 1972
2.686
+0.818
43.78%
jan 1, 1973
3.714
+1.028
38.27%
jan 1, 1974
3.796
+0.082
2.21%
jan 1, 1975
4.476
+0.681
17.93%
jan 1, 1976
4.762
+0.285
6.38%
jan 1, 1977
5.318
+0.556
11.68%
jan 1, 1978
5.889
+0.571
10.74%
jan 1, 1979
6.838
+0.948
16.1%
jan 1, 1980
7.46
+0.622
9.1%
jan 1, 1981
8.012
+0.552
7.39%
jan 1, 1982
8.846
+0.834
10.41%
jan 1, 1983
9.631
+0.785
8.88%
jan 1, 1984
10.137
+0.506
5.25%
jan 1, 1985
10.174
+0.037
0.36%
jan 1, 1986
12.508
+2.334
22.94%
jan 1, 1987
11.716
-0.791
-6.33%
jan 1, 1988
11.321
-0.395
-3.37%
jan 1, 1989
11.377
+0.055
0.49%
jan 1, 1990
10.933
-0.443
-3.9%
jan 1, 1991
12.846
+1.913
17.49%
jan 1, 1992
12.131
-0.715
-5.57%
jan 1, 1993
12.258
+0.127
1.04%
jan 1, 1994
12.322
+0.064
0.52%
jan 1, 1995
12.841
+0.519
4.21%
jan 1, 1996
13.605
+0.764
5.95%
jan 1, 1997
12.74
-0.864
-6.35%
jan 1, 1998
12.678
-0.063
-0.49%
jan 1, 1999
12.732
+0.054
0.43%
jan 1, 2000
12.925
+0.193
1.52%
jan 1, 2001
13.4
+0.476
3.68%
jan 1, 2002
14.321
+0.92
6.87%
jan 1, 2003
14.394
+0.073
0.51%
jan 1, 2004
13.972
-0.421
-2.93%
jan 1, 2005
13.738
-0.234
-1.68%
jan 1, 2006
12.409
-1.329
-9.67%
jan 1, 2007
14.493
+2.084
16.8%
jan 1, 2008
16.312
+1.819
12.55%
jan 1, 2009
16.97
+0.658
4.03%
jan 1, 2010
17.015
+0.044
0.26%
jan 1, 2011
17.472
+0.458
2.69%
jan 1, 2012
18.19
+0.718
4.11%
jan 1, 2013
17.149
-1.041
-5.72%
jan 1, 2014
18.016
+0.867
5.06%
Ranking of countries by current statistics by years


Comments: