29
/
en
AIzaSyAYiBZKx7MnpbEhh9jyipgxe19OcubqV5w
April 1, 2024
33285
European Union
EUU
false
2
1
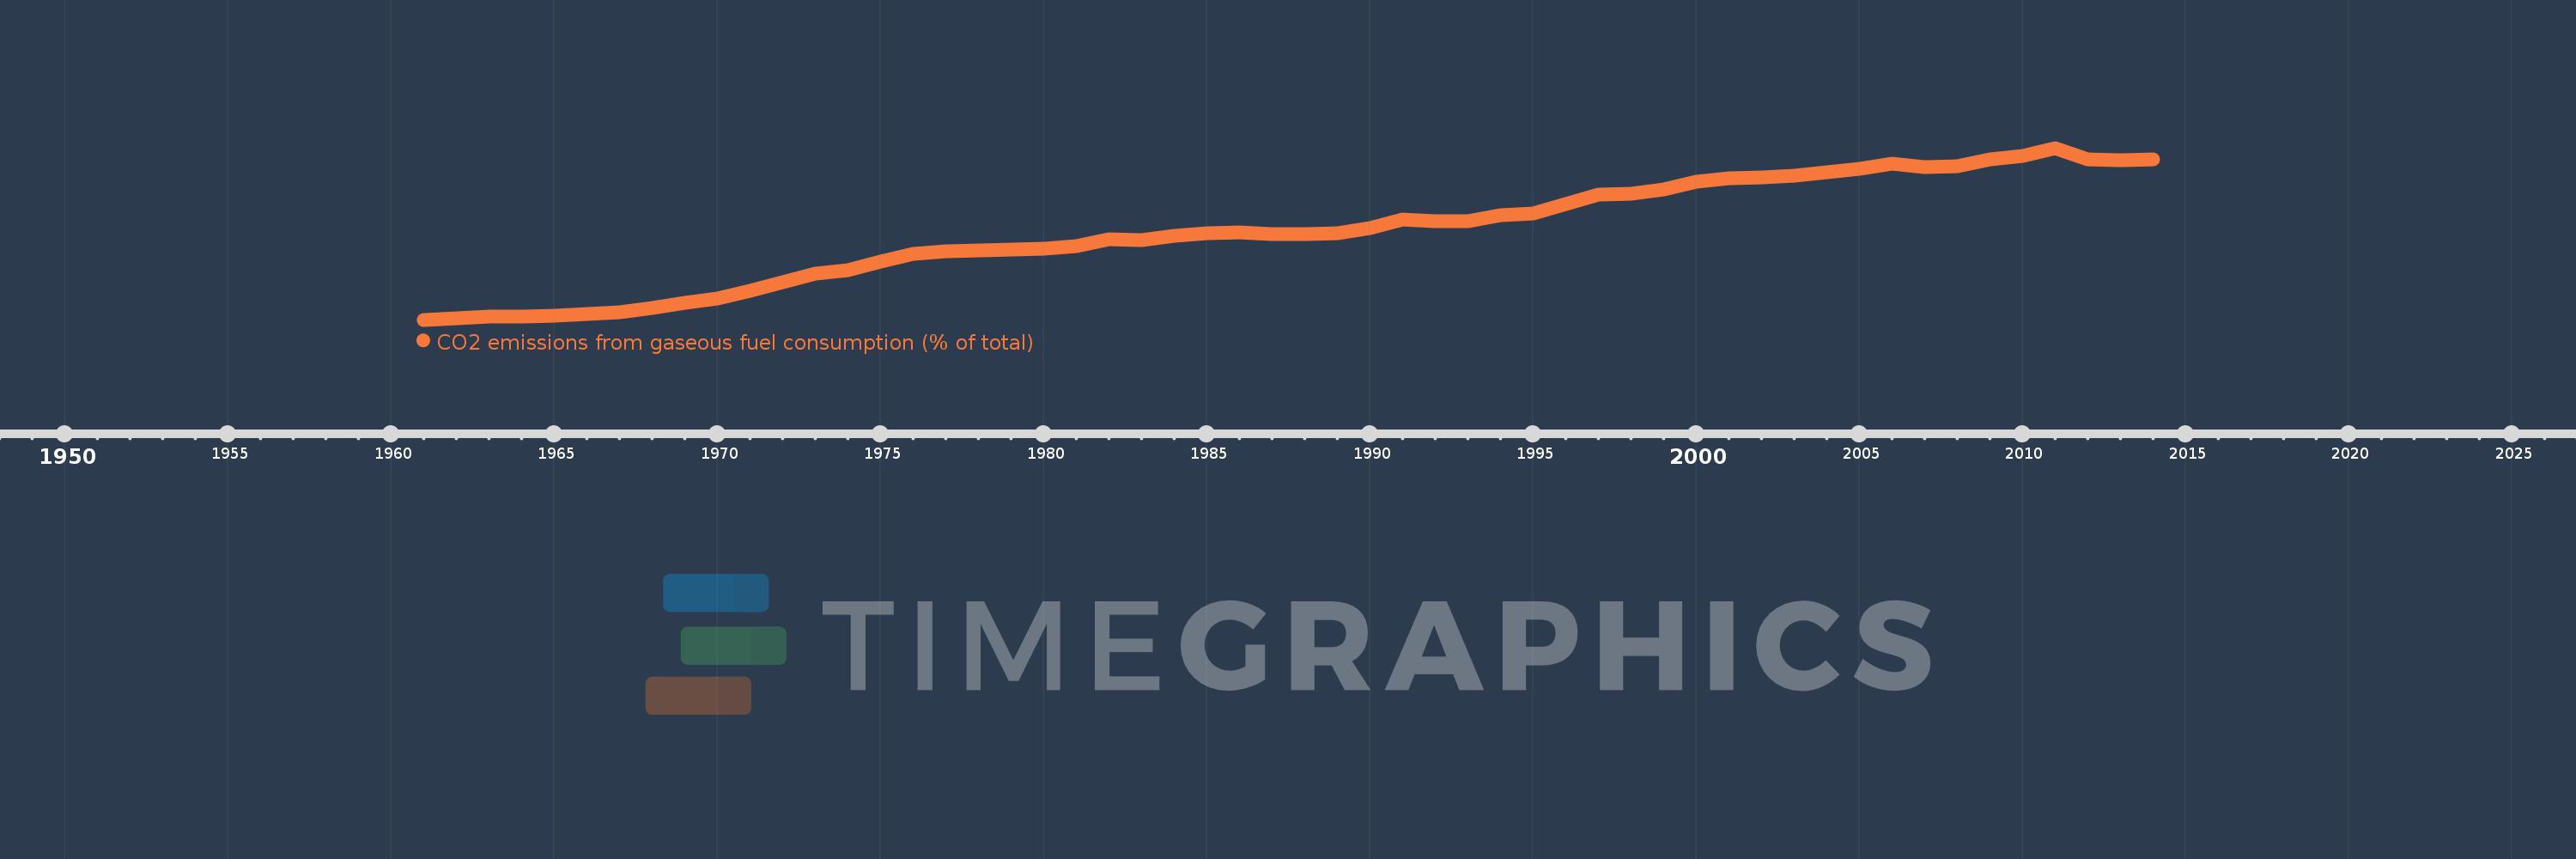
CO2 emissions from gaseous fuel consumption (% of total)
2014,2013,2012,2011,2010,2009,2008,2007,2006,2005,2004,2003,2002,2001,2000,1999,1998,1997,1996,1995,1994,1993,1992,1991,1990,1989,1988,1987,1986,1985,1984,1983,1982,1981,1980,1979,1978,1977,1976,1975,1974,1973,1972,1971,1970,1969,1968,1967,1966,1965,1964,1963,1962,1961
This statistics in other country:
AfghanistanAlbaniaAlgeriaAndorraAngolaAntigua and BarbudaArab WorldArgentinaArmeniaArubaAustraliaAustriaAzerbaijanBahamas, TheBahrainBangladeshBarbadosBelarusBelgiumBelizeBeninBermudaBhutanBoliviaBosnia and HerzegovinaBotswanaBrazilBritish Virgin IslandsBrunei DarussalamBulgariaBurkina FasoBurundiCabo VerdeCambodiaCameroonCanadaCaribbean small statesCayman IslandsCentral African RepublicCentral Europe and the BalticsChadChileChinaColombiaComorosCongo, Dem. Rep.Congo, Rep.Costa RicaCote d'IvoireCroatiaCubaCuracaoCyprusCzech RepublicDenmarkDjiboutiDominicaDominican RepublicEarly-demographic dividendEast Asia & PacificEast Asia & Pacific (excluding high income)East Asia & Pacific (IDA & IBRD countries)EcuadorEgypt, Arab Rep.El SalvadorEquatorial GuineaEritreaEstoniaEthiopiaEuro areaEurope & Central AsiaEurope & Central Asia (excluding high income)Europe & Central Asia (IDA & IBRD countries)European UnionFaroe IslandsFijiFinlandFragile and conflict affected situationsFranceFrench PolynesiaGabonGambia, TheGeorgiaGermanyGhanaGibraltarGreeceGreenlandGrenadaGuatemalaGuineaGuinea-BissauGuyanaHaitiHeavily indebted poor countries (HIPC)High incomeHondurasHong Kong SAR, ChinaHungaryIBRD onlyIcelandIDA & IBRD totalIDA blendIDA onlyIDA totalIndiaIndonesiaIran, Islamic Rep.IraqIrelandIsraelItalyJamaicaJapanJordanKazakhstanKenyaKiribatiKorea, Dem. People’s Rep.Korea, Rep.KuwaitKyrgyz RepublicLao PDRLate-demographic dividendLatin America & Caribbean Latin America & Caribbean (excluding high income)Latin America & the Caribbean (IDA & IBRD countries)LatviaLeast developed countries: UN classificationLebanonLesothoLiberiaLibyaLiechtensteinLithuaniaLow & middle incomeLow incomeLower middle incomeLuxembourgMacao SAR, ChinaMacedonia, FYRMadagascarMalawiMalaysiaMaldivesMaliMaltaMarshall IslandsMauritaniaMauritiusMexicoMicronesia, Fed. Sts.Middle East & North AfricaMiddle East & North Africa (excluding high income)Middle East & North Africa (IDA & IBRD countries)Middle incomeMoldovaMongoliaMontenegroMoroccoMozambiqueMyanmarNamibiaNauruNepalNetherlandsNew CaledoniaNew ZealandNicaraguaNigerNigeriaNorth AmericaNorwayOECD membersOmanOther small statesPacific island small statesPakistanPalauPanamaPapua New GuineaParaguayPeruPhilippinesPolandPortugalPost-demographic dividendPre-demographic dividendQatarRomaniaRussian FederationRwandaSamoaSao Tome and PrincipeSaudi ArabiaSenegalSerbiaSeychellesSierra LeoneSingaporeSint Maarten (Dutch part)Slovak RepublicSloveniaSmall statesSolomon IslandsSomaliaSouth AfricaSouth AsiaSouth Asia (IDA & IBRD)South SudanSpainSri LankaSt. Kitts and NevisSt. LuciaSt. Vincent and the GrenadinesSub-Saharan Africa Sub-Saharan Africa (excluding high income)Sub-Saharan Africa (IDA & IBRD countries)SudanSurinameSwazilandSwedenSwitzerlandSyrian Arab RepublicTajikistanTanzaniaThailandTimor-LesteTogoTongaTrinidad and TobagoTunisiaTurkeyTurkmenistanTurks and Caicos IslandsUgandaUkraineUnited Arab EmiratesUnited KingdomUnited StatesUpper middle incomeUruguayUzbekistanVanuatuVenezuela, RBVietnamWest Bank and GazaWorldYemen, Rep.ZambiaZimbabwe Timeline:
This timeline shows a graph from 1961 to 2014 of European Union. No data until 1960. Number of actual observations by date: 54.
Source name:
World Development Indicators
Source organization:
Carbon Dioxide Information Analysis Center, Environmental Sciences Division, Oak Ridge National Laboratory, Tennessee, United States.
Categories, topics:
Energy & Mining, Climate Change, Environment
Last updated:
apr 23, 2017
Indicators value changes by year
Maximum:
27.644
jan 1, 2011
At the date of observation
Value
Absolute change
Change from previous value
jan 1, 1961
2.646
+2.646
0.0%
jan 1, 1962
2.854
+0.208
7.87%
jan 1, 1963
3.05
+0.196
6.86%
jan 1, 1964
3.065
+0.015
0.49%
jan 1, 1965
3.178
+0.114
3.71%
jan 1, 1966
3.425
+0.246
7.75%
jan 1, 1967
3.739
+0.314
9.18%
jan 1, 1968
4.339
+0.6
16.04%
jan 1, 1969
5.059
+0.72
16.6%
jan 1, 1970
5.696
+0.637
12.59%
jan 1, 1971
6.813
+1.117
19.61%
jan 1, 1972
8.111
+1.298
19.06%
jan 1, 1973
9.361
+1.25
15.41%
jan 1, 1974
9.848
+0.487
5.2%
jan 1, 1975
11.148
+1.301
13.21%
jan 1, 1976
12.232
+1.084
9.72%
jan 1, 1977
12.557
+0.324
2.65%
jan 1, 1978
12.752
+0.195
1.56%
jan 1, 1979
12.866
+0.114
0.89%
jan 1, 1980
12.989
+0.123
0.95%
jan 1, 1981
13.392
+0.403
3.1%
jan 1, 1982
14.384
+0.992
7.41%
jan 1, 1983
14.224
-0.16
-1.11%
jan 1, 1984
14.874
+0.65
4.57%
jan 1, 1985
15.23
+0.355
2.39%
jan 1, 1986
15.399
+0.169
1.11%
jan 1, 1987
15.117
-0.282
-1.83%
jan 1, 1988
15.12
+0.003
0.02%
jan 1, 1989
15.291
+0.171
1.13%
jan 1, 1990
15.979
+0.688
4.5%
jan 1, 1991
17.249
+1.27
7.94%
jan 1, 1992
16.938
-0.311
-1.8%
jan 1, 1993
16.954
+0.016
0.09%
jan 1, 1994
17.878
+0.924
5.45%
jan 1, 1995
18.108
+0.23
1.29%
jan 1, 1996
19.489
+1.381
7.63%
jan 1, 1997
20.91
+1.421
7.29%
jan 1, 1998
20.961
+0.05
0.24%
jan 1, 1999
21.584
+0.624
2.98%
jan 1, 2000
22.677
+1.093
5.06%
jan 1, 2001
23.23
+0.553
2.44%
jan 1, 2002
23.325
+0.095
0.41%
jan 1, 2003
23.558
+0.232
1.0%
jan 1, 2004
24.072
+0.515
2.18%
jan 1, 2005
24.628
+0.555
2.31%
jan 1, 2006
25.308
+0.681
2.76%
jan 1, 2007
24.838
-0.47
-1.86%
jan 1, 2008
24.92
+0.082
0.33%
jan 1, 2009
25.991
+1.072
4.3%
jan 1, 2010
26.451
+0.46
1.77%
jan 1, 2011
27.644
+1.192
4.51%
jan 1, 2012
25.949
-1.695
-6.13%
jan 1, 2013
25.82
-0.128
-0.49%
jan 1, 2014
25.973
+0.152
0.59%
Ranking of countries by current statistics by years


Comments: