29
/
en
AIzaSyAYiBZKx7MnpbEhh9jyipgxe19OcubqV5w
April 1, 2024
163579
Japan
JPN
true
2
1
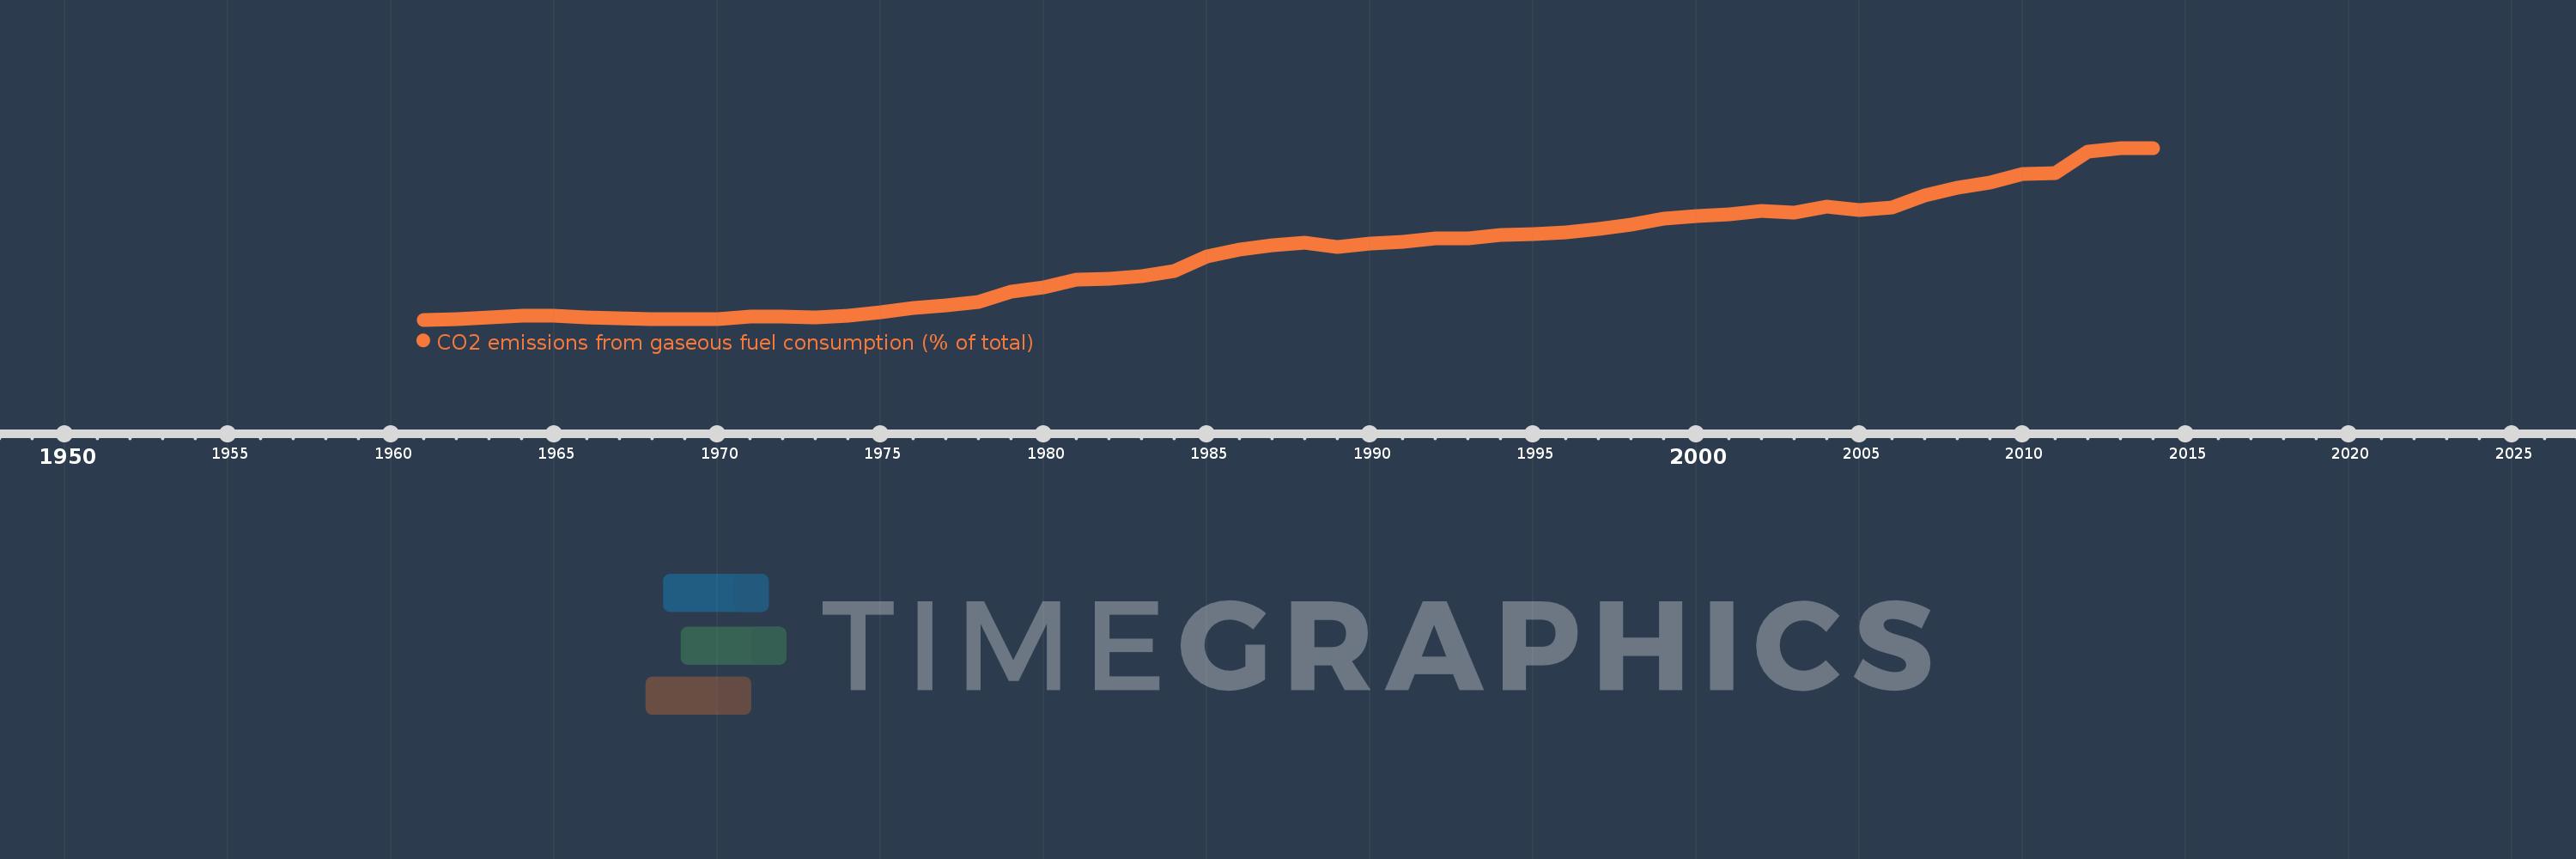
CO2 emissions from gaseous fuel consumption (% of total)
2014,2013,2012,2011,2010,2009,2008,2007,2006,2005,2004,2003,2002,2001,2000,1999,1998,1997,1996,1995,1994,1993,1992,1991,1990,1989,1988,1987,1986,1985,1984,1983,1982,1981,1980,1979,1978,1977,1976,1975,1974,1973,1972,1971,1970,1969,1968,1967,1966,1965,1964,1963,1962,1961
This statistics in other country:
AfghanistanAlbaniaAlgeriaAndorraAngolaAntigua and BarbudaArab WorldArgentinaArmeniaArubaAustraliaAustriaAzerbaijanBahamas, TheBahrainBangladeshBarbadosBelarusBelgiumBelizeBeninBermudaBhutanBoliviaBosnia and HerzegovinaBotswanaBrazilBritish Virgin IslandsBrunei DarussalamBulgariaBurkina FasoBurundiCabo VerdeCambodiaCameroonCanadaCaribbean small statesCayman IslandsCentral African RepublicCentral Europe and the BalticsChadChileChinaColombiaComorosCongo, Dem. Rep.Congo, Rep.Costa RicaCote d'IvoireCroatiaCubaCuracaoCyprusCzech RepublicDenmarkDjiboutiDominicaDominican RepublicEarly-demographic dividendEast Asia & PacificEast Asia & Pacific (excluding high income)East Asia & Pacific (IDA & IBRD countries)EcuadorEgypt, Arab Rep.El SalvadorEquatorial GuineaEritreaEstoniaEthiopiaEuro areaEurope & Central AsiaEurope & Central Asia (excluding high income)Europe & Central Asia (IDA & IBRD countries)European UnionFaroe IslandsFijiFinlandFragile and conflict affected situationsFranceFrench PolynesiaGabonGambia, TheGeorgiaGermanyGhanaGibraltarGreeceGreenlandGrenadaGuatemalaGuineaGuinea-BissauGuyanaHaitiHeavily indebted poor countries (HIPC)High incomeHondurasHong Kong SAR, ChinaHungaryIBRD onlyIcelandIDA & IBRD totalIDA blendIDA onlyIDA totalIndiaIndonesiaIran, Islamic Rep.IraqIrelandIsraelItalyJamaicaJapanJordanKazakhstanKenyaKiribatiKorea, Dem. People’s Rep.Korea, Rep.KuwaitKyrgyz RepublicLao PDRLate-demographic dividendLatin America & Caribbean Latin America & Caribbean (excluding high income)Latin America & the Caribbean (IDA & IBRD countries)LatviaLeast developed countries: UN classificationLebanonLesothoLiberiaLibyaLiechtensteinLithuaniaLow & middle incomeLow incomeLower middle incomeLuxembourgMacao SAR, ChinaMacedonia, FYRMadagascarMalawiMalaysiaMaldivesMaliMaltaMarshall IslandsMauritaniaMauritiusMexicoMicronesia, Fed. Sts.Middle East & North AfricaMiddle East & North Africa (excluding high income)Middle East & North Africa (IDA & IBRD countries)Middle incomeMoldovaMongoliaMontenegroMoroccoMozambiqueMyanmarNamibiaNauruNepalNetherlandsNew CaledoniaNew ZealandNicaraguaNigerNigeriaNorth AmericaNorwayOECD membersOmanOther small statesPacific island small statesPakistanPalauPanamaPapua New GuineaParaguayPeruPhilippinesPolandPortugalPost-demographic dividendPre-demographic dividendQatarRomaniaRussian FederationRwandaSamoaSao Tome and PrincipeSaudi ArabiaSenegalSerbiaSeychellesSierra LeoneSingaporeSint Maarten (Dutch part)Slovak RepublicSloveniaSmall statesSolomon IslandsSomaliaSouth AfricaSouth AsiaSouth Asia (IDA & IBRD)South SudanSpainSri LankaSt. Kitts and NevisSt. LuciaSt. Vincent and the GrenadinesSub-Saharan Africa Sub-Saharan Africa (excluding high income)Sub-Saharan Africa (IDA & IBRD countries)SudanSurinameSwazilandSwedenSwitzerlandSyrian Arab RepublicTajikistanTanzaniaThailandTimor-LesteTogoTongaTrinidad and TobagoTunisiaTurkeyTurkmenistanTurks and Caicos IslandsUgandaUkraineUnited Arab EmiratesUnited KingdomUnited StatesUpper middle incomeUruguayUzbekistanVanuatuVenezuela, RBVietnamWest Bank and GazaWorldYemen, Rep.ZambiaZimbabwe Timeline:
This timeline shows a graph from 1961 to 2014 of Japan. No data until 1960. Number of actual observations by date: 54.
Source name:
World Development Indicators
Source organization:
Carbon Dioxide Information Analysis Center, Environmental Sciences Division, Oak Ridge National Laboratory, Tennessee, United States.
Categories, topics:
Energy & Mining, Climate Change, Environment
Last updated:
apr 23, 2017
Indicators value changes by year
Maximum:
19.621
jan 1, 2013
At the date of observation
Value
Absolute change
Change from previous value
jan 1, 1961
0.688
+0.688
0.0%
jan 1, 1962
0.723
+0.034
4.99%
jan 1, 1963
0.908
+0.185
25.62%
jan 1, 1964
1.13
+0.222
24.44%
jan 1, 1965
1.115
-0.014
-1.27%
jan 1, 1966
0.934
-0.182
-16.31%
jan 1, 1967
0.882
-0.051
-5.48%
jan 1, 1968
0.799
-0.084
-9.48%
jan 1, 1969
0.752
-0.046
-5.82%
jan 1, 1970
0.722
-0.03
-3.99%
jan 1, 1971
0.999
+0.277
38.35%
jan 1, 1972
1.016
+0.016
1.64%
jan 1, 1973
0.936
-0.079
-7.81%
jan 1, 1974
1.156
+0.22
23.51%
jan 1, 1975
1.547
+0.391
33.81%
jan 1, 1976
1.973
+0.426
27.52%
jan 1, 1977
2.277
+0.304
15.42%
jan 1, 1978
2.642
+0.364
15.99%
jan 1, 1979
3.82
+1.179
44.62%
jan 1, 1980
4.282
+0.462
12.09%
jan 1, 1981
5.063
+0.78
18.22%
jan 1, 1982
5.231
+0.169
3.34%
jan 1, 1983
5.531
+0.299
5.72%
jan 1, 1984
6.041
+0.51
9.23%
jan 1, 1985
7.633
+1.592
26.35%
jan 1, 1986
8.416
+0.784
10.27%
jan 1, 1987
8.884
+0.468
5.56%
jan 1, 1988
9.139
+0.255
2.87%
jan 1, 1989
8.723
-0.416
-4.55%
jan 1, 1990
9.049
+0.326
3.74%
jan 1, 1991
9.23
+0.181
2.0%
jan 1, 1992
9.685
+0.455
4.93%
jan 1, 1993
9.695
+0.01
0.1%
jan 1, 1994
10.067
+0.372
3.84%
jan 1, 1995
10.16
+0.092
0.92%
jan 1, 1996
10.297
+0.137
1.35%
jan 1, 1997
10.688
+0.391
3.8%
jan 1, 1998
11.175
+0.487
4.56%
jan 1, 1999
11.851
+0.676
6.05%
jan 1, 2000
12.142
+0.291
2.46%
jan 1, 2001
12.323
+0.181
1.49%
jan 1, 2002
12.651
+0.328
2.66%
jan 1, 2003
12.491
-0.159
-1.26%
jan 1, 2004
13.151
+0.66
5.28%
jan 1, 2005
12.771
-0.38
-2.89%
jan 1, 2006
13.045
+0.274
2.15%
jan 1, 2007
14.409
+1.364
10.45%
jan 1, 2008
15.193
+0.784
5.44%
jan 1, 2009
15.848
+0.655
4.31%
jan 1, 2010
16.758
+0.909
5.74%
jan 1, 2011
16.816
+0.058
0.35%
jan 1, 2012
19.247
+2.431
14.45%
jan 1, 2013
19.621
+0.374
1.95%
jan 1, 2014
19.58
-0.042
-0.21%
Ranking of countries by current statistics by years


Comments: