29
/
en
AIzaSyAYiBZKx7MnpbEhh9jyipgxe19OcubqV5w
April 1, 2024
41280
Latin America & Caribbean
LCN
false
2
1
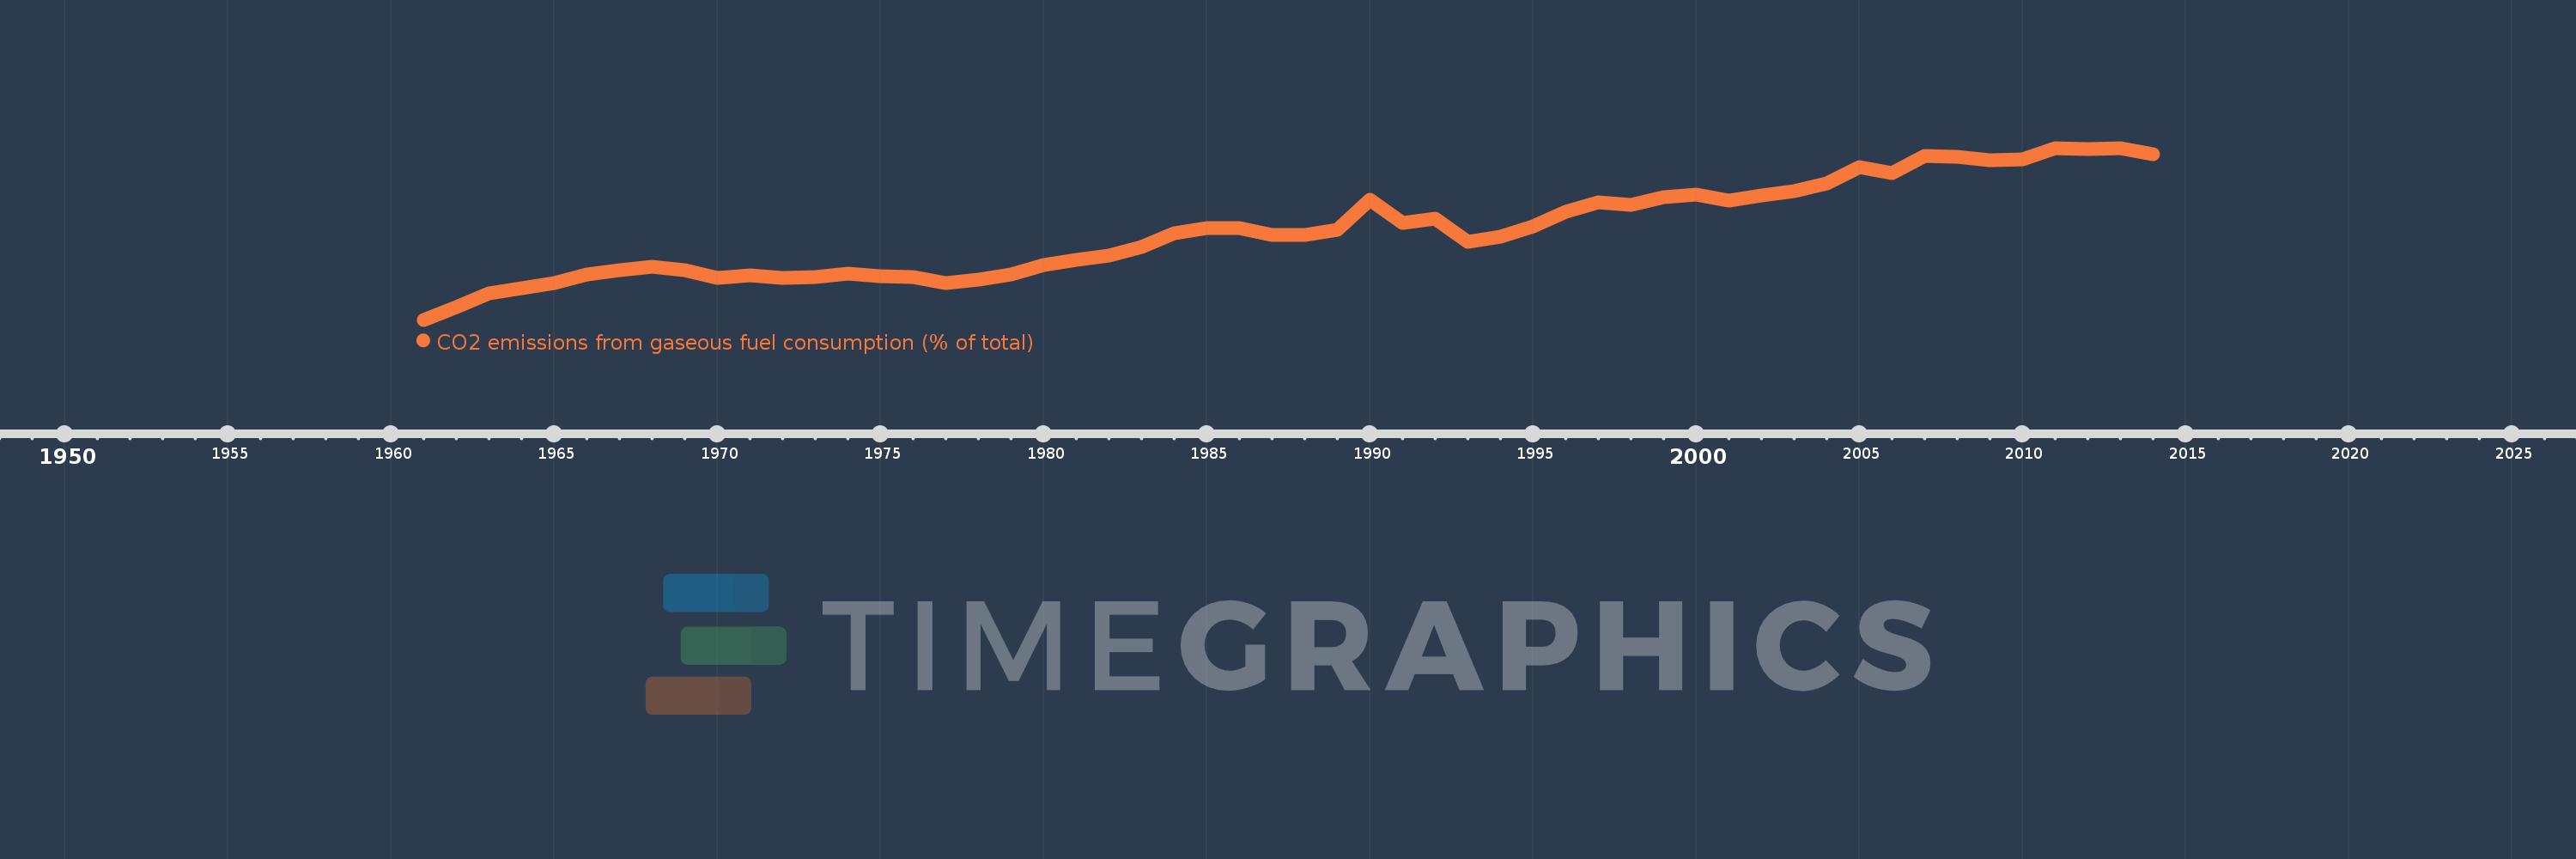
CO2 emissions from gaseous fuel consumption (% of total)
2014,2013,2012,2011,2010,2009,2008,2007,2006,2005,2004,2003,2002,2001,2000,1999,1998,1997,1996,1995,1994,1993,1992,1991,1990,1989,1988,1987,1986,1985,1984,1983,1982,1981,1980,1979,1978,1977,1976,1975,1974,1973,1972,1971,1970,1969,1968,1967,1966,1965,1964,1963,1962,1961
This statistics in other country:
AfghanistanAlbaniaAlgeriaAndorraAngolaAntigua and BarbudaArab WorldArgentinaArmeniaArubaAustraliaAustriaAzerbaijanBahamas, TheBahrainBangladeshBarbadosBelarusBelgiumBelizeBeninBermudaBhutanBoliviaBosnia and HerzegovinaBotswanaBrazilBritish Virgin IslandsBrunei DarussalamBulgariaBurkina FasoBurundiCabo VerdeCambodiaCameroonCanadaCaribbean small statesCayman IslandsCentral African RepublicCentral Europe and the BalticsChadChileChinaColombiaComorosCongo, Dem. Rep.Congo, Rep.Costa RicaCote d'IvoireCroatiaCubaCuracaoCyprusCzech RepublicDenmarkDjiboutiDominicaDominican RepublicEarly-demographic dividendEast Asia & PacificEast Asia & Pacific (excluding high income)East Asia & Pacific (IDA & IBRD countries)EcuadorEgypt, Arab Rep.El SalvadorEquatorial GuineaEritreaEstoniaEthiopiaEuro areaEurope & Central AsiaEurope & Central Asia (excluding high income)Europe & Central Asia (IDA & IBRD countries)European UnionFaroe IslandsFijiFinlandFragile and conflict affected situationsFranceFrench PolynesiaGabonGambia, TheGeorgiaGermanyGhanaGibraltarGreeceGreenlandGrenadaGuatemalaGuineaGuinea-BissauGuyanaHaitiHeavily indebted poor countries (HIPC)High incomeHondurasHong Kong SAR, ChinaHungaryIBRD onlyIcelandIDA & IBRD totalIDA blendIDA onlyIDA totalIndiaIndonesiaIran, Islamic Rep.IraqIrelandIsraelItalyJamaicaJapanJordanKazakhstanKenyaKiribatiKorea, Dem. People’s Rep.Korea, Rep.KuwaitKyrgyz RepublicLao PDRLate-demographic dividendLatin America & Caribbean Latin America & Caribbean (excluding high income)Latin America & the Caribbean (IDA & IBRD countries)LatviaLeast developed countries: UN classificationLebanonLesothoLiberiaLibyaLiechtensteinLithuaniaLow & middle incomeLow incomeLower middle incomeLuxembourgMacao SAR, ChinaMacedonia, FYRMadagascarMalawiMalaysiaMaldivesMaliMaltaMarshall IslandsMauritaniaMauritiusMexicoMicronesia, Fed. Sts.Middle East & North AfricaMiddle East & North Africa (excluding high income)Middle East & North Africa (IDA & IBRD countries)Middle incomeMoldovaMongoliaMontenegroMoroccoMozambiqueMyanmarNamibiaNauruNepalNetherlandsNew CaledoniaNew ZealandNicaraguaNigerNigeriaNorth AmericaNorwayOECD membersOmanOther small statesPacific island small statesPakistanPalauPanamaPapua New GuineaParaguayPeruPhilippinesPolandPortugalPost-demographic dividendPre-demographic dividendQatarRomaniaRussian FederationRwandaSamoaSao Tome and PrincipeSaudi ArabiaSenegalSerbiaSeychellesSierra LeoneSingaporeSint Maarten (Dutch part)Slovak RepublicSloveniaSmall statesSolomon IslandsSomaliaSouth AfricaSouth AsiaSouth Asia (IDA & IBRD)South SudanSpainSri LankaSt. Kitts and NevisSt. LuciaSt. Vincent and the GrenadinesSub-Saharan Africa Sub-Saharan Africa (excluding high income)Sub-Saharan Africa (IDA & IBRD countries)SudanSurinameSwazilandSwedenSwitzerlandSyrian Arab RepublicTajikistanTanzaniaThailandTimor-LesteTogoTongaTrinidad and TobagoTunisiaTurkeyTurkmenistanTurks and Caicos IslandsUgandaUkraineUnited Arab EmiratesUnited KingdomUnited StatesUpper middle incomeUruguayUzbekistanVanuatuVenezuela, RBVietnamWest Bank and GazaWorldYemen, Rep.ZambiaZimbabwe Timeline:
This timeline shows a graph from 1961 to 2014 of Latin America & Caribbean . No data until 1960. Number of actual observations by date: 54.
Source name:
World Development Indicators
Source organization:
Carbon Dioxide Information Analysis Center, Environmental Sciences Division, Oak Ridge National Laboratory, Tennessee, United States.
Categories, topics:
Energy & Mining, Climate Change, Environment
Last updated:
apr 23, 2017
Indicators value changes by year
Maximum:
24.795
jan 1, 2013
At the date of observation
Value
Absolute change
Change from previous value
jan 1, 1961
7.236
+7.236
0.0%
jan 1, 1962
8.501
+1.265
17.48%
jan 1, 1963
9.898
+1.398
16.44%
jan 1, 1964
10.428
+0.53
5.35%
jan 1, 1965
11.024
+0.596
5.71%
jan 1, 1966
11.893
+0.869
7.88%
jan 1, 1967
12.259
+0.366
3.08%
jan 1, 1968
12.653
+0.394
3.21%
jan 1, 1969
12.275
-0.378
-2.99%
jan 1, 1970
11.47
-0.805
-6.56%
jan 1, 1971
11.817
+0.347
3.03%
jan 1, 1972
11.476
-0.341
-2.89%
jan 1, 1973
11.636
+0.161
1.4%
jan 1, 1974
11.964
+0.328
2.81%
jan 1, 1975
11.712
-0.252
-2.11%
jan 1, 1976
11.616
-0.096
-0.82%
jan 1, 1977
11.015
-0.6
-5.17%
jan 1, 1978
11.36
+0.345
3.13%
jan 1, 1979
11.831
+0.471
4.14%
jan 1, 1980
12.843
+1.011
8.55%
jan 1, 1981
13.315
+0.473
3.68%
jan 1, 1982
13.834
+0.518
3.89%
jan 1, 1983
14.673
+0.84
6.07%
jan 1, 1984
16.037
+1.364
9.29%
jan 1, 1985
16.623
+0.587
3.66%
jan 1, 1986
16.602
-0.021
-0.13%
jan 1, 1987
15.894
-0.708
-4.26%
jan 1, 1988
15.938
+0.044
0.28%
jan 1, 1989
16.419
+0.481
3.02%
jan 1, 1990
19.46
+3.041
18.52%
jan 1, 1991
17.096
-2.364
-12.15%
jan 1, 1992
17.587
+0.491
2.87%
jan 1, 1993
15.191
-2.396
-13.62%
jan 1, 1994
15.745
+0.553
3.64%
jan 1, 1995
16.737
+0.992
6.3%
jan 1, 1996
18.265
+1.528
9.13%
jan 1, 1997
19.259
+0.994
5.44%
jan 1, 1998
18.937
-0.321
-1.67%
jan 1, 1999
19.727
+0.79
4.17%
jan 1, 2000
19.993
+0.266
1.35%
jan 1, 2001
19.394
-0.599
-2.99%
jan 1, 2002
19.92
+0.526
2.71%
jan 1, 2003
20.345
+0.425
2.13%
jan 1, 2004
21.132
+0.787
3.87%
jan 1, 2005
22.839
+1.707
8.08%
jan 1, 2006
22.201
-0.638
-2.79%
jan 1, 2007
23.973
+1.772
7.98%
jan 1, 2008
23.854
-0.119
-0.5%
jan 1, 2009
23.571
-0.283
-1.19%
jan 1, 2010
23.624
+0.053
0.22%
jan 1, 2011
24.736
+1.113
4.71%
jan 1, 2012
24.689
-0.047
-0.19%
jan 1, 2013
24.795
+0.106
0.43%
jan 1, 2014
24.137
-0.658
-2.65%
Ranking of countries by current statistics by years


Comments: