29
/
en
AIzaSyAYiBZKx7MnpbEhh9jyipgxe19OcubqV5w
April 1, 2024
69570
Argentina
ARG
true
2
1
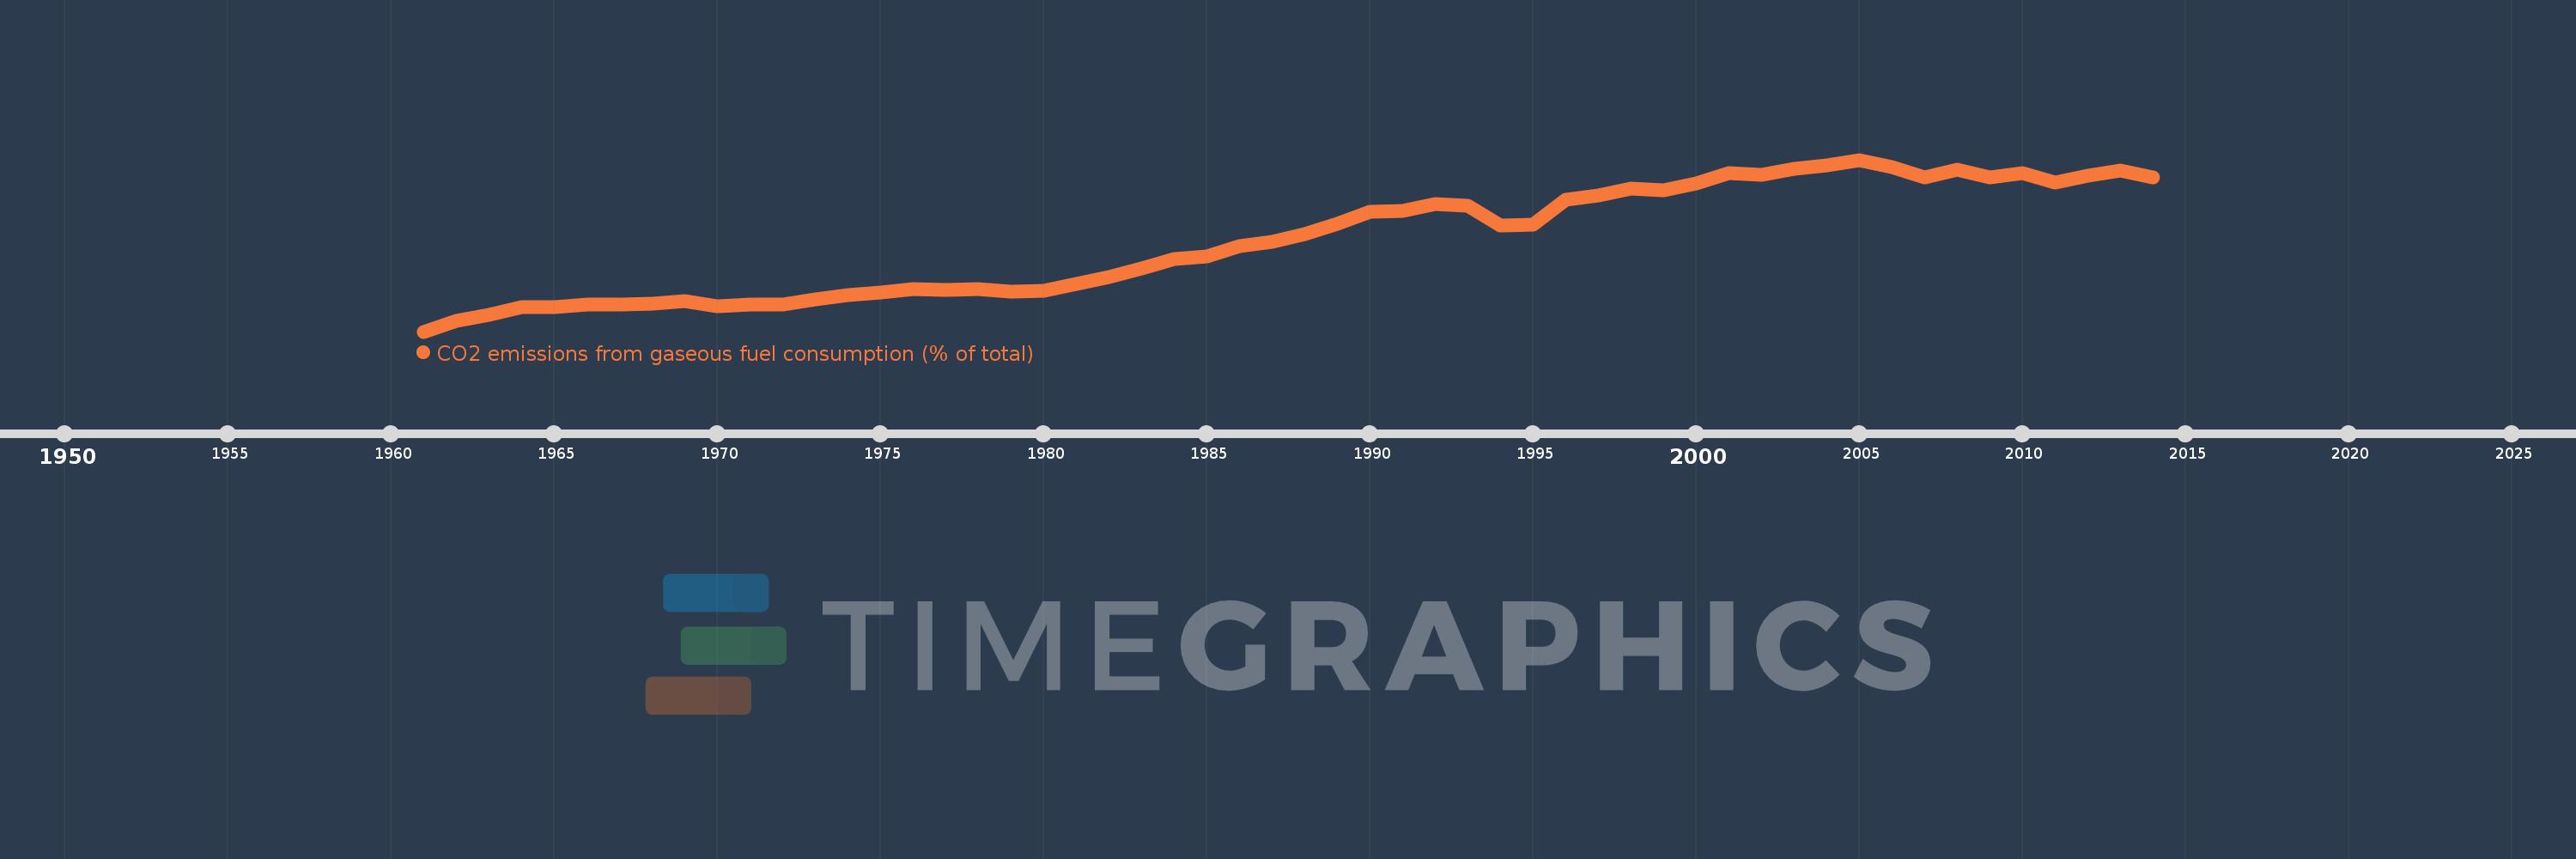
CO2 emissions from gaseous fuel consumption (% of total)
2014,2013,2012,2011,2010,2009,2008,2007,2006,2005,2004,2003,2002,2001,2000,1999,1998,1997,1996,1995,1994,1993,1992,1991,1990,1989,1988,1987,1986,1985,1984,1983,1982,1981,1980,1979,1978,1977,1976,1975,1974,1973,1972,1971,1970,1969,1968,1967,1966,1965,1964,1963,1962,1961
This statistics in other country:
AfghanistanAlbaniaAlgeriaAndorraAngolaAntigua and BarbudaArab WorldArgentinaArmeniaArubaAustraliaAustriaAzerbaijanBahamas, TheBahrainBangladeshBarbadosBelarusBelgiumBelizeBeninBermudaBhutanBoliviaBosnia and HerzegovinaBotswanaBrazilBritish Virgin IslandsBrunei DarussalamBulgariaBurkina FasoBurundiCabo VerdeCambodiaCameroonCanadaCaribbean small statesCayman IslandsCentral African RepublicCentral Europe and the BalticsChadChileChinaColombiaComorosCongo, Dem. Rep.Congo, Rep.Costa RicaCote d'IvoireCroatiaCubaCuracaoCyprusCzech RepublicDenmarkDjiboutiDominicaDominican RepublicEarly-demographic dividendEast Asia & PacificEast Asia & Pacific (excluding high income)East Asia & Pacific (IDA & IBRD countries)EcuadorEgypt, Arab Rep.El SalvadorEquatorial GuineaEritreaEstoniaEthiopiaEuro areaEurope & Central AsiaEurope & Central Asia (excluding high income)Europe & Central Asia (IDA & IBRD countries)European UnionFaroe IslandsFijiFinlandFragile and conflict affected situationsFranceFrench PolynesiaGabonGambia, TheGeorgiaGermanyGhanaGibraltarGreeceGreenlandGrenadaGuatemalaGuineaGuinea-BissauGuyanaHaitiHeavily indebted poor countries (HIPC)High incomeHondurasHong Kong SAR, ChinaHungaryIBRD onlyIcelandIDA & IBRD totalIDA blendIDA onlyIDA totalIndiaIndonesiaIran, Islamic Rep.IraqIrelandIsraelItalyJamaicaJapanJordanKazakhstanKenyaKiribatiKorea, Dem. People’s Rep.Korea, Rep.KuwaitKyrgyz RepublicLao PDRLate-demographic dividendLatin America & Caribbean Latin America & Caribbean (excluding high income)Latin America & the Caribbean (IDA & IBRD countries)LatviaLeast developed countries: UN classificationLebanonLesothoLiberiaLibyaLiechtensteinLithuaniaLow & middle incomeLow incomeLower middle incomeLuxembourgMacao SAR, ChinaMacedonia, FYRMadagascarMalawiMalaysiaMaldivesMaliMaltaMarshall IslandsMauritaniaMauritiusMexicoMicronesia, Fed. Sts.Middle East & North AfricaMiddle East & North Africa (excluding high income)Middle East & North Africa (IDA & IBRD countries)Middle incomeMoldovaMongoliaMontenegroMoroccoMozambiqueMyanmarNamibiaNauruNepalNetherlandsNew CaledoniaNew ZealandNicaraguaNigerNigeriaNorth AmericaNorwayOECD membersOmanOther small statesPacific island small statesPakistanPalauPanamaPapua New GuineaParaguayPeruPhilippinesPolandPortugalPost-demographic dividendPre-demographic dividendQatarRomaniaRussian FederationRwandaSamoaSao Tome and PrincipeSaudi ArabiaSenegalSerbiaSeychellesSierra LeoneSingaporeSint Maarten (Dutch part)Slovak RepublicSloveniaSmall statesSolomon IslandsSomaliaSouth AfricaSouth AsiaSouth Asia (IDA & IBRD)South SudanSpainSri LankaSt. Kitts and NevisSt. LuciaSt. Vincent and the GrenadinesSub-Saharan Africa Sub-Saharan Africa (excluding high income)Sub-Saharan Africa (IDA & IBRD countries)SudanSurinameSwazilandSwedenSwitzerlandSyrian Arab RepublicTajikistanTanzaniaThailandTimor-LesteTogoTongaTrinidad and TobagoTunisiaTurkeyTurkmenistanTurks and Caicos IslandsUgandaUkraineUnited Arab EmiratesUnited KingdomUnited StatesUpper middle incomeUruguayUzbekistanVanuatuVenezuela, RBVietnamWest Bank and GazaWorldYemen, Rep.ZambiaZimbabwe Timeline:
This timeline shows a graph from 1961 to 2014 of Argentina. No data until 1960. Number of actual observations by date: 54.
Source name:
World Development Indicators
Source organization:
Carbon Dioxide Information Analysis Center, Environmental Sciences Division, Oak Ridge National Laboratory, Tennessee, United States.
Categories, topics:
Energy & Mining, Climate Change, Environment
Last updated:
apr 23, 2017
Indicators value changes by year
Maximum:
52.656
jan 1, 2005
At the date of observation
Value
Absolute change
Change from previous value
jan 1, 1961
4.845
+4.845
0.0%
jan 1, 1962
7.881
+3.036
62.66%
jan 1, 1963
9.52
+1.639
20.79%
jan 1, 1964
11.649
+2.129
22.36%
jan 1, 1965
11.614
-0.035
-0.3%
jan 1, 1966
12.322
+0.708
6.09%
jan 1, 1967
12.44
+0.119
0.96%
jan 1, 1968
12.532
+0.092
0.74%
jan 1, 1969
13.244
+0.712
5.68%
jan 1, 1970
11.784
-1.46
-11.02%
jan 1, 1971
12.437
+0.653
5.54%
jan 1, 1972
12.402
-0.035
-0.28%
jan 1, 1973
13.841
+1.439
11.6%
jan 1, 1974
15.094
+1.253
9.05%
jan 1, 1975
15.628
+0.534
3.54%
jan 1, 1976
16.575
+0.947
6.06%
jan 1, 1977
16.515
-0.06
-0.36%
jan 1, 1978
16.787
+0.272
1.65%
jan 1, 1979
16.016
-0.77
-4.59%
jan 1, 1980
16.287
+0.271
1.69%
jan 1, 1981
18.008
+1.721
10.57%
jan 1, 1982
20.092
+2.084
11.57%
jan 1, 1983
22.497
+2.405
11.97%
jan 1, 1984
24.983
+2.486
11.05%
jan 1, 1985
25.65
+0.667
2.67%
jan 1, 1986
28.663
+3.013
11.75%
jan 1, 1987
29.737
+1.075
3.75%
jan 1, 1988
31.954
+2.217
7.46%
jan 1, 1989
34.794
+2.84
8.89%
jan 1, 1990
38.129
+3.335
9.58%
jan 1, 1991
38.404
+0.275
0.72%
jan 1, 1992
40.439
+2.035
5.3%
jan 1, 1993
39.805
-0.634
-1.57%
jan 1, 1994
34.432
-5.373
-13.5%
jan 1, 1995
34.628
+0.196
0.57%
jan 1, 1996
41.604
+6.976
20.15%
jan 1, 1997
42.659
+1.056
2.54%
jan 1, 1998
44.603
+1.944
4.56%
jan 1, 1999
44.104
-0.499
-1.12%
jan 1, 2000
46.042
+1.938
4.39%
jan 1, 2001
48.892
+2.85
6.19%
jan 1, 2002
48.505
-0.386
-0.79%
jan 1, 2003
50.25
+1.744
3.6%
jan 1, 2004
51.181
+0.931
1.85%
jan 1, 2005
52.656
+1.475
2.88%
jan 1, 2006
50.604
-2.052
-3.9%
jan 1, 2007
47.845
-2.759
-5.45%
jan 1, 2008
49.806
+1.961
4.1%
jan 1, 2009
47.694
-2.112
-4.24%
jan 1, 2010
48.936
+1.242
2.6%
jan 1, 2011
46.296
-2.64
-5.39%
jan 1, 2012
48.353
+2.057
4.44%
jan 1, 2013
49.625
+1.272
2.63%
jan 1, 2014
47.854
-1.772
-3.57%
Ranking of countries by current statistics by years


Comments: